Estimation of Leaf Area Index and Land Use Correlation in Blueberry Orchards Using Geospatial Technology
480 likes | 613 Views
This study investigates the estimation of Leaf Area Index (LAI) and land use correlation in a blueberry orchard (Z-Blu Farm) using high-resolution orthoimagery and Object-Based Image Analysis (OBIA) techniques. We focus on estimating LAI values influenced by various blueberry species and growth stages while analyzing hydrologic parameters such as stomatal conductance, soil moisture, and canopy temperature. The study emphasizes the role of geospatial technology in accurate water management and irrigation scheduling for improved crop production.

Estimation of Leaf Area Index and Land Use Correlation in Blueberry Orchards Using Geospatial Technology
E N D
Presentation Transcript
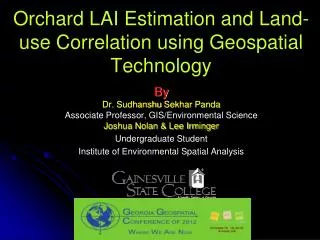
Orchard LAI Estimation and Land-use Correlation using Geospatial Technology By Dr. Sudhanshu Sekhar Panda Associate Professor, GIS/Environmental Science Joshua Nolan & Lee Irminger Undergraduate Student Institute of Environmental Spatial Analysis
Background • Major quantity of soil and plant available water is lost by evapotranspiration (ET). • Most Irrigation scheduling for crop is conducted based on ET. • The loss of water due to ET varies with different crops including horticultural plants. • It is difficult to estimate ET for large orchards. • Hydrologic parameters like stomatal conductance, soil moisture, leaf area index (LAI), plant canopy temperature, and wind velocity are functions of plant ET. • These hydrologic attributes together can be modeled to estimate ET.
Background • Remote sensing has the proven ability for measuring some of those parameters in quick and cost-effective manner • Hydrologic parameters like stomatal conductance, soil moisture, LAI, and plant canopy temperature can be estimated on a spatial basis using remotely sensed imagery. • Horticultural plants of different species and growth stages demonstrate different values for these hydrologic parameters that ultimately help estimate the ET. • Geospatial Technology has the ability to decipher those plants of different species and growth stages in an orchard.
Objectives • The objectives of this study is to • Estimate LAI of a blueberry orchard (Z-Blu Farm) and surrounding windbreaker forest cover using high resolution orthoimagery. • Conduct the land-use classification or orchard speciation using Object-based Image Analysis (OBIA) technique. • Correlate the LAI to different species present in the orchard.
Study Area • Z-Blu Farm (130 acres blueberry plantation) in Nahunta, GA • Very Well managed orchard • Two varieties of blueberry – High Bush and Rabbit Eye and 3 stages of blueberry plants due to expansion of the orchard since 2004 • Other land-uses present are forest (windbreaker), bare soil, and grass
Data & Software • 6” (15 cm) resolution Color Infrared (CIR) imagery (R, G, and NIR bands) through Photoscience Geospatial Inc. • Field LAI data with LAI-2200 Canopy Analyzer (LI-COR Biosciences, Lincoln, NE ) • IDRISI Taiga (Clark Labs, Clark University, Worcester, MA) software • eCognition (Trimble Geospatial, Westminster, CO) Developer software • QT Modeler (Applied Imagery, Silver Spring, MD) software • ArcGIS 10 (ESRI, Redlands, CA) software
Orthoimagery (15 cm resolution) Nahunta CIR Imagery Nahunta_Red Band Nahunta_NIR Band Nahunta_Green Band
LAI Raster Development • LAI raster was developed for the Z-Blu orchard using the relationship developed by Schultz and Engman (2000) LAI = - ln (SAVI + .371)/.48 • Which calculates LAI from the soil adjusted vegetation index (SAVI) from NAIP orthoimagery
SAVI Raster Development • SAVI raster is created by the algorithm developed Huete (1988) • where rand ir are spectral reflectance from the R-and NIR-band images, respectively, and the L is a constant that represents the vegetation density. • Huete(1988) defined the optimal adjustment factor of L = 0.25 to be considered for higher vegetation density in the field, L = 0.5 for intermediate vegetation density, and L = 1 for the low vegetation density.
OBIA Based Image Segmentation • Individual bands (R-, G-, and NIR-band) were extracted from the CIR image • LiDAR data was used to produce ground elevation raster (DEM) and the plant height raster (nDSM) using the QT Modeler software • NDVI raster was developed using the algorithm • Another raster was developed following the WATER algorithm developed by Nolan (2011) • where r , g and ir are spectral reflectance from the R-, G- and NIR-band images, respectively NDVI = (ir - r) / (ir + r) WATER = (g - ir) /(g + ir)
Rule Sets Developed for Image Segmentation • All these rasters (previous slide) were imported to eCognition software • Rule sets were developed for distinguishing individual classes including blueberry species from the study area image • Multiresolution segmentation (MRS) or other segmentation techniques were used in many steps to have classes distinguished
Blueberry LAI Correlation • Segmentation of the orchard image provided different blueberry species along with bare soil and grass. • Visual correlation was conducted on classified image versus LAI raster • The field collected LAI values were correlated with the LAI values obtained from the image analysis to observe relationship.
OBIA Segmentation Raster Series(Tall & Short Features separation)
Multiresolution Segmentation for Differentiating Various Classes of Tall Objects
Multiresolution Segmentation for Differentiating Various Classes of Short Objects
High Bush Blueberry Variety Distinction (NDVI between 0.2 and 0.4)
Rabbit Eye Blueberry Variety Distinction (compactness greater than 3 )
MRS Region Grow Segmentation to Obtain Larger Objects in Rabbit Eye
Conclusions • LAI raster was developed using the SAVI raster of the study area 0.15 cm resolution CIR. • The LAI values very well visually correlated with two blueberry varieties (High Bush and Rabbit Eye) in the field. • The LAI values from the LAI raster and the values collected from field did not correlate well. • It was attributed to the faulty LICOR instrument • We will collect LAI data in the field later with a better instrument
Conclusions • The OBIA based image segmentation process was very exhaustive but worth every extra rule sets we develop • SAVI raster very clearly distinguished different vegetation features in the image including both blueberry varieties (High Bush and Rabbit Eye) • We would use that in the OBIA segmentation process and it would save a great deal of effort • Ground truth will be conducted later for accuracy assessment but initial assessment shows the result more than 80% accurate • Ground truth points were collected in 2009 for a previous study but 2010 orthoimagery is used in this study • Different stages (year of plantation) of blueberry plants in the orchard will be separated with the nDSM raster in a later stage
Acknowledgement • This work was supported in part by the Georgia Space Grant Program, managed by the Georgia Institute of Technology on behalf of the National Aeronautics and Space Administration, and by State and Federal Funds allocated to Georgia Agricultural Experiment Stations Hatch project GEO1654.
Thank You & ?
LAI raster for entire land-use (Ranges from -7.59 to -11.377)
LAI raster showing the LAI values (very homogenous) of only Kudzu (Ranges from -11 to -11.315)