Download
1 / 16
160 likes | 267 Views
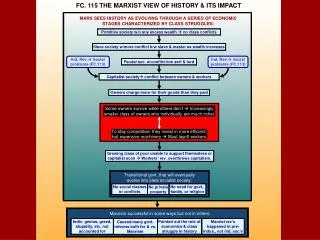
An Economic Perspective on Black Hartford’s History & Future. Diane L. Smith April 10, 2008. General Overview. Population Income Housing Education. Changes in Hartford Population. In 1950, Hartford’s Population was less than 10% black.

E N D
An Economic Perspective on Black Hartford’s History & Future Diane L. Smith April 10, 2008
General Overview • Population • Income • Housing • Education
Changes in Hartford Population • In 1950, Hartford’s Population was less than 10% black. • By 1990, the population was 40% black, 40% White and 20% Hispanic. • 2006 estimates Hartford’s black population at 37% • The city has lost more than a third of its population since 1950
Concentration of Black Population 1950 -1980 Black population begins and concentrates in north end Figure 1 Black Population 1950 Figure 2 Black Population 1960 Figure 3 Black Population 1970 Figure 4 Black Population 1980
Income DistributionMedian Income • In general, median income for blacks in the US is 67% of whites from 1967 to 1980
Income DistributionMedian Income • In 2000, Hartford median income was 46% of the state’s median. Hartford black media was just about equal to the city’s level. • 2006 Census data estimates for CT black median income falling to 59% of whites; $70K vs. $41K
Income DistributionPoverty • Hartford’s poverty rate in 2006 was 32% compared to the State’s at 8% • 26% of Hartford black population lived at poverty income levels
Income DistributionPoverty Geographically - Hartford 2000 1990
Income Distribution Hartford Revenue • Hartford receives about 46% of its annual revenues from taxes; another 45% from intergovernmental sources • Property tax (residential and commercial) is the source of most of the tax revenue • The state provides more than 80% of the intergovernmental funds to the city
Housing Opportunity • Historically, blacks occupied the oldest units in the city as well as the largest developments
Housing Opportunity • In 1960, about 25% of Hartford’s housing stock had been built in the last ten years • By 2000, only 4% of the city’s stock had been built in the last decade. • Nearly one third of Hartford’s housing was built before 1939
Housing Opportunity • More than half of Hartford’s housing was comprised of single family units in 1960. • By 2000 that percentage had shrunk to one fifth. • Another on fifth of the housing in 2000 were developments of 20, 50 or more units.
Education • 41% of Hartford’s student enrollment is black. • Hartford’s 3rd, 4th, and 5th graders had the lowest proportion of students meeting goals for reading in the state in the 06-07 year. • The high school graduation rate for Hartford students 2006 was 76% compared to the state rate of 92%. • State Dept. of Education reports 38.7% of Hartford adults don’t have a high school diploma.
EducationHartford Expenditures • Hartford’s 2007-08 budget includes $261MM for education. A total of 51% of its general fund budget
The Challenge for Black Hartford • Access and commitment to wealth building strategies including: • Successful schools and education • Employment opportunities that are economically viable • Homeownership opportunities • Public policies and investment that support: • Educational infrastructure responsive to current and future student needs • Strategic economic development including small business development • Neighborhood revitalization • Private interest and investment that complement public purpose