Download
1 / 32
320 likes | 423 Views
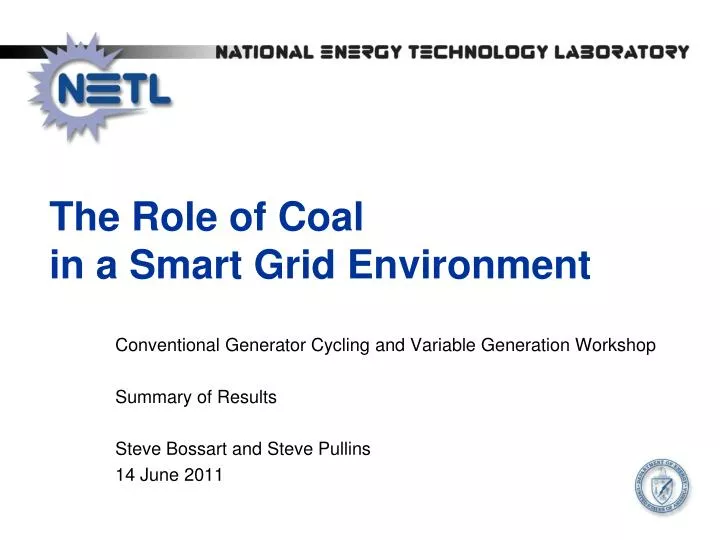
The Role of Coal in a Smart Grid Environment. Conventional Generator Cycling and Variable Generation Workshop Summary of Results Steve Bossart and Steve Pullins 14 June 2011. Focus of the Analysis. How much the baseload might change as Smart Grid technologies are adopted

E N D
The Role of Coal in a Smart Grid Environment Conventional Generator Cycling and Variable Generation Workshop Summary of Results Steve Bossart and Steve Pullins 14 June 2011
Focus of the Analysis • How much the baseload might change as Smart Grid technologies are adopted • Ways that coal might service this changing baseload, including centralized generation, distributed generation (DG), and combined heat and power (CHP) • Coal’s potential to provide ancillary services and reserves in a Smart Grid, including supporting higher renewable generation capacity
Utility Study Recommendations* • Baseload changes and their impacts on centralized generation • Coal in distributed generation (DG) applications • Coal in combined heat and power (CHP) applications • Coal’s role in integrating renewables *FirstEnergy, HECO, TVA, Great River Energy, Midwest ISO
How Cities are Supplied Today To support consumption of 1 MW: Requires central-station production of ~1.2 MW (line losses, transformation losses, congestion losses) Requires central-station installation of ~2.2 MW (average fleet capacity factor ~45%) Requires distributed production of ~1 MW Requires distributed installation of ~1.3 MW Note: 21.4 percent of NG is shared between NG base and NG Peak
City Sizes – 2000 Census Area of Interest – hundreds of small to medium size cities where the transformation to a Smart Grid may lead to a small clean coal fit. Number of Municipalities Population [in thousands]
Smart Grid 2020 City Summary • Renewables and consumers are driving a distribution network focus in the transformation of the electric system. • The prime location for grid change is the city urban/suburban area. • Of the US municipalities there are hundreds of small to medium sized US cities. • Based on local initiatives, economic development, and reliability needs, the mid-size cities are expected to lead the transformation of the electric system to a Smart Grid. • If clean coal is to play a role in the Smart Grid, it will likely start in these cities, where only a few of the many industrial consumers are needed within the city to create combined heat and power (CHP) applications in industrial parks at the city’s edge.
Smart Grid 2020 City – Model Summary All of the electricity data in EIA is based on metered accounts, not person population. This requires the use of meter data for computing averages and projections. For example, EIA has the total number of US residential, commercial, and industrial meters, thus we can ratio commercial and industrial meter counts based on choosing the number of residential meters. EIA data also gives us the average load per meter in residential, commercial, and industrial, thus we can calculate the total average load for the “typical” city. Exhibit 6-4 Smart Grid 2020 City Characteristics
Smart Grid 2020 City Generation Mix A proprietary Internal Rate of Return (IRR) optimization algorithm is run combining installed cost, operating hours/year, renewables energy delivery, energy storage required, and percentage of base generation needed. Constraint were added for some components of the mix. E.G., a constraint was added for clean coal DG baseload to be between 50 - 90MW, and a constraint was added for sum of renewables to meet the 20% Renewable Energy Portfolio assumption. • From Exhibit 6-5 New Resources for the Smart Grid 2020 City and Exhibit 6-6 Delivered Electricity Mix
Denmark Transformation – 1985 - 2009 Exhibit B-11 Denmark Electric Power Infrastructure 1985 and Exhibit B-12 Denmark Electric Power Infrastructure 2009 • Source: [57, 58]
400 kV 150 kV 60 kV 10-20 kV 0.4 kV 4 (central) 6 (central) 17 (dispersed) 475 (dispersed) 260 (dispersed) CHP units 1488 MW 2014 MW 569 MW 991 MW 83 MW 80 34 2180 1860 Wind units 160 MW 41 MW 1597 MW 576 MW Non-dispatchable (beyond central control) Centrally controlled Generation Capacity, West Denmark, 2008 Exhibit B-14 Generation Capacity per Voltage Level, West Denmark 2008 • Source: [51]
Small Clean Coal (IGCC) is Doable Plant Installed Capital Cost ($/kWe) vs Size $3,500/kW for a small IGCC with a Recip or Hybrid back end today. Projecting to 2017 for start of construction, the cost will be ~$4,182/kW The Smart Grid 2020 City model uses the IGCC – Recip plant in a CHP application without CCS. Exhibit A-11 Plant Cost of Electricity vs. Size
Smart Grid 2020 City Summary • The consumers save $15.4M annually on their electric bills. • The emissions footprint is reduced by 198,189 tons/year. • The electric rate is nearly flat for 25 years (0.1% escalation/yr). • The small clean coal plant is an essential energy and stability resource as well as supporting CHP and renewables penetration. • With >300 potential industrial firms to partner with, finding 1 or 2 small clean coal CHP candidates is doable.
Electric Power System Moving To A Smart Grid • Current • Large centralized plants serving baseload • Future • Large centralized plants serving baseload…plus • Small dispersed plants serving baseload and other applications including: • Load following, spinning reserve, grid stability • Other ancillary services
Industry Implications • The Smart Grid offers a reason to have small clean coal plants in poly-plant applications. • Small clean coal plants are much better at supporting CHP and other poly-plant applications than large central-station generators miles from the city. • The Smart Grid 2020 City will offer many candidates for CHP / poly-plant applications where the small clean coal plant would be viewed favorably compared to natural gas for its lower, flat fuel cost and higher capacity factor.
Coal-based Poly-plants • Improve economics and flexibility of small coal plants • Feedstock • Coal and biomass • Products • Steam, chemicals, chemical feedstock, transportation fuels, electricity, syngas • Combined heat and power
Electric Power System Electric Power System Analysis Fossil Energy Mission Generation/ Storage OE Mission Large-Scale Generation/ Storage Transmission Distribution Consumer Generation/ Storage Renewables Advanced Power Generation Fuel Cells Existing Plants Gasification Turbines Carbon Management Hydrogen & Syngas NREL Mission
Leverage Smart Grid City 2020 Analysis How does Smart Grid enable: • Improved baseload generation operation • Applications of distributed clean coal generation • Clean coal – CHP applications • Clean coal – renewables partnership • Valuation of true cost of electricity Should develop a non-proprietary optimization model for distributed/centralized power systems
A. Improved Baseload Generation Operations • How does reduced peak demand shifts load (demand and energy) to baseload? • What is future role of coal plants in meeting baseload (centralized and distributed mix)? • How will Smart Grid improve efficiency of baseload? • Capital cost, O&M cost, environmental benefits ? • How will Smart Grid impact the use of IGCC (centralized and distributed)?
B. Applications for Distributed Coal Plants • What are appropriate size and type of coal plants? • Do the economics drive a poly-plant application every time? • Fuel management issues? • Waste management issues? • Microgrid potential? • What impacts on prices, reliability, and environment? • What opportunities for servicing reactive power, regulation, and reserve requirements?
C. Clean Coal – CHP Applications • What is feasibility of applying Danish “hybrid” CHP model to US CHP model using clean coal? • What would be economic impact? • What would be impact on local environment? • What are the process or heating applications that are best served by this model? • What is the likelihood of a Clean Coal – CHP demonstration project? • 300 industrial sites per 400 typical mid-size US cities
D. Clean Coal – Renewables Partnership • Are there states or communities particularly interested in developing a clean coal – renewables mix? • Is there a specific strategy to retain a state’s coal economy while incorporating significant renewables? • What are the impacts on economics, efficiency, reliability, & environment?
E. True Cost of Electricity • Should we be using LCODE vs LCOE? • Levelized cost of energy (LCOE) • Levelized cost of delivered energy (LCODE) • What is the balance of central and distributed generation? • How should we handle poly-plant economics?
Report www.netl.doe.gov/energy-analyses/ NETL Contact: Joel Theis, Economist, NETL/IEPS Prepared by: Energy Sector Planning and Analysis (ESPA) Booz Allen Hamilton, Inc. Jovan Ilic, Shawn Rabiei, Marija Prica, David Wilson, Jesse Goellner Horizon Energy GroupSteve Pullins, Joe Miller, Tom Grabowski WorleyParsons Group, Inc. Harvey Goldstein, Paul MylesSextant Technical Services, LLC Chris Wyatt, Steven Knudsen
From the 20th to the 21st Century 25 M residential solar 1 M PHEV/PEV 10 M PHEV/PEV 50 M PHEV/PEV 2 M architectural wind 5 M building solar 500 wind parks 50 solar parks 5,000 distributed wind 5,000 utility solar 100,000 Buildings as PP Changeover to more and more digital loads Consumer choices Continued increase in energy intensity Prices increasing, in some regions faster than gasoline at the pump
What is different with Smart Grid? • Decentralized supply and control • Two-way power flow • Two-way information flow • Consumer involvement • Enable intermittent renewables • Increased interaction between T & D & C assets • Increased complexity of wholesale & retail markets • Ancillary services markets • Transformation of transportation sector with EVs • Transitioning from passive to active control 29
Smart Grid Architectural Significance • Multiple resource integration • Volt, VAR, variability (VVV) management • Distributed control • Improved electric market use and interaction • Recognition of distributed resources (load and generation) addressing the peak demand • Increased need for local baseload generation in the mix for stability • Need for higher energy efficiency in production and delivery
Specific Cross-cutting Studies to Explore • Impact of carbon legislation and CCS (technologies, legislation) • Impact of types of coal plants including poly-plants • Impact of penetration of intermittent renewables (CES, RPS, max) • Impact of various options for e-storage (type, amount) • Ability of distributed coal plants to serve ancillary services (load following, regulation, reserves, etc) • Impact of loss of inertial momentum of large turbines – more toward smaller coal plants and increased renewables • Impact of Smart Grid on asset management & utilization – Generation, T&D, and consumer asset • Impact of changes to investment tax credits (e.g., renewables, EVs) • Impact of city size and load characteristics
Ancillary Services • System control, • Voltage control, • Regulation, • Load following, • Spinning reserve, • Supplemental reserve, • Backup supply, • Energy Imbalance, • Real-power-loss replacement, • Dynamic scheduling, • System-black-start capability, • Network stability