Download
1 / 11
120 likes | 312 Views
7.1 Shapes of Function Graphs. Lesson Objective: IWBAT recognize a type of function by its graph. Guiding Question: What do the graphs of each type of function look like?. 4 types of functions to focus on Linear Quadrilateral Power Exponential

E N D
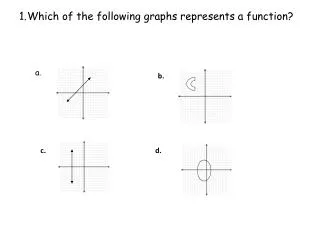
7.1 Shapes of Function Graphs Lesson Objective: IWBAT recognize a type of function by its graph.
Guiding Question: What do the graphs of each type of function look like? • 4 types of functions to focus on • Linear • Quadrilateral • Power • Exponential How can we use these functions to represent data?
Guiding Question: What do the graphs of each type of function look like? Linear Function y = mx+b Think about what kinds of data are represented linearly. • Other forms • Ax + By = C where A,B, & C are numbers.
Guiding Question: What do the graphs of each type of function look like? Example 1. A Pizza Hut spends $1,250 per month on supplies to make pizza. If they make $2.50 per pizza, how many do they need to sell to break even? What’s the function look like? What’s the graph look like? What’s the solution?
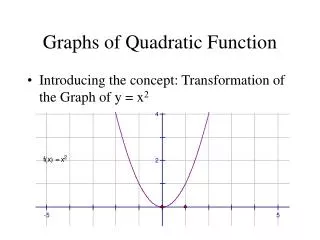
Guiding Question: What do the graphs of each type of function look like? This is what the graph looks like. Quadratic Function are numbers Other forms y = a (h, k) is the vertex What kind of data gets represented with this?
Guiding Question: What do the graphs of each type of function look like? • An object is launched straight up into the air at an initial velocity of 64 feet per second. It is launched from a height of 6 feet off the ground. Its height H, in feet, at t seconds is given by the equation H = -16+ 64t + 6. Find all times t that the object is at a height of 54 feet off the ground. • What would this graph look like? • What are the solution(s)?
Guiding Question: What do the graphs of each type of function look like? Exponential function This is what the graph looks like. • x is a measure of time. Usually this represents growth or decay over a course of time involving a population or a bacterial growth
Guiding Question: What do the graphs of each type of function look like? An adult takes 400 mg of ibuprofen. Each hour, the amount of ibuprofen in the person’s system decreases by about 29%. How much ibuprofen is left after 6 hours? • What would the function look like? • How much is left after hours 1-5? • Answer the problem
Guiding Question: What do the graphs of each type of function look like? Power Function: Many different graphs are considered power functions. a & b are numbers Quadratic and linear are power functions.
Guiding Question: What do the graphs of each type of function look like? • What would the graph look like? • How would it change if the exponent was 5, or 6?
Guiding Question: What do the graphs of each type of function look like? • Assignment: Pg. 293 1-4