Download

1 / 69
690 likes | 831 Views
Tools to explore dynamics of visual search & biological behavior. Deborah J. Aks. RU-Center for Cognitive Sciences (RuCCs) 4/24/07--Presentation for E. Sontag’s BioMath Seminar: Mathematics as Biology's New Microscope. Background reading: Long-range fractal dynamic in visual perception

E N D
Tools to explore dynamics of visual search & biological behavior. Deborah J. Aks RU-Center for Cognitive Sciences (RuCCs) 4/24/07--Presentation for E. Sontag’s BioMath Seminar:Mathematics as Biology's New Microscope Background reading:Long-range fractal dynamic in visual perception http://aks.rutgers.edu/AksInfo/Papers/Pubs/1_Perceptual_Dynamics/ daks@rci.rutgers.edu 4/17/07-update
Scale-free --> Rethinking what we study & measure Typical scale = Central tendency Power laws! Many # # Few Small Large Size Size (of an event, object or behavior)
Overview • Visual search study---------------------------- • Tools to study dynamics • Stats, time-series analysis, FFT… • Power laws • Possible source(s) of (1/f) power laws:SOC, feedback & recurrent models
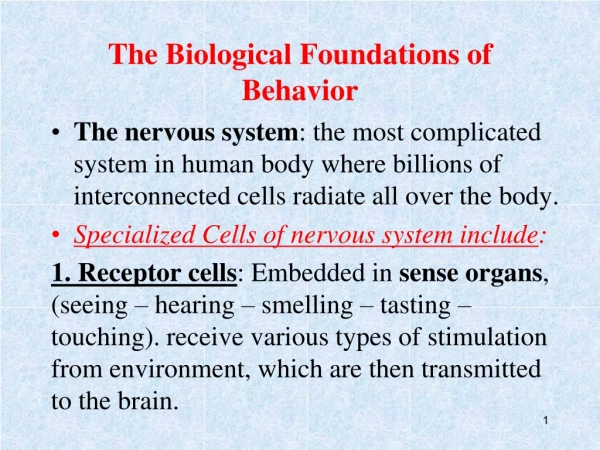
Visual Search in Medical images • Detecting tumors in: • Mammograms x-rays, CT-scans • Ultrasound • MRI…
Edward J. Delp Purdue University School of Electrical and Computer Engineering; Video and Image Processing Laboratory (VIPER) The Analysis of Digital Mammograms: Spiculated Tumor Detectionand Normal Mammogram Characterization West Lafayette, Indiana, ace@ecn.purdue.edu http://bmrc.berkeley.edu/courseware/cs298/fall99/delp/berkeley99.htm http://www.ece.purdue.edu/~ace
Normal Mammograms Edward J. Delp Purdue University School of Electrical and Computer Engineering; Video and Image Processing Laboratory (VIPER) The Analysis of Digital Mammograms: Spiculated Tumor Detectionand Normal Mammogram Characterization West Lafayette, Indiana, ace@ecn.purdue.edu
Diagnostic Features • Abnormal Markings: • Spiculation or a stellate appearance • Shape & contours: --spicules or “arms” • --irregular, ill-defined borders • Size: • --variable: mm to cm • --Larger the tumor center, the longer its spicules • ------------------------------------------------------------------------ • Normal Markings: • Linear & smooth masses • Normal ducts & connective tissue elements Abnormal & Normal Masses, Calcification..
Human -vs- Computer-aided detection • Which is better?Both use search, feature detection & classification • detecting (1 of 3) abnormal structures • classifying breast lesions as benign or malignant • Human advantage: • Pattern recognition & (implicit) learning • (Unsystematic) search patterns can be effective • Fewer false positives • Computer advantage: • No fatigue • Superior explicit memory • Only biases are those built into algorithm • Thorough & systematic search
Non-systematic human eye-movements (especially in unstructured environments) Engle, 1977; Ellis & Stark, 1988; Scinto & Pillalamarri, 1986; Krendel & Wodinsky, 1960; Groner & Groner, 1982
Visual Search Task Find the upright “T” T T T T T T T T T T T T T T T T T T T T T T T T T T T T T T T T T T T
QUESTIONS. • What guides complicated eye movements? • Random or non-random process? • Is there memory across fixations? • Might neural interactions drive search? • METHOD OF TESTING. • Challenging visual search task
Method. • Each trial contained 81 Ts. • 400 trials lasting 2.5hours. • Eight 20-minute sessions Aks, D. J. Zelinsky G. & Sprott J. C. (2002). Memory Across Eye-Movements: 1/f Dynamic in Visual Search. Nonlinear Dynamics, Psychology and Life Sciences, 6 (1), 1-15.
Map trajectory of eye scan-paths: • x,y coordinates (location) • --------------------------------------------------------- • Saccadic eye-movements & Fixations: • Differences • xn – xn+1 &yn – yn+1 • Distance =(x2 + y2)1/2 • Direction = Arctan (y/x) • Duration (msec, sec…)
Dynamical tools • Descriptive & Correlational Statistics • Time Series • Scatter & Delay plots • Probability Distributions (PDFs) • Power spectra (FFT)…
Additional tools • Autocorrelation • Recurrent maps • Relative Dispersion (SD/M) • Iterated Functions Systems (IFS) • Rescaled range R/S (Hurst exponent)--running sum of deviations from mean/SD evaluate persistence & anti-persistence
Results (from our preliminary experiment) Conventional search stats… What’s the central tendency? • 24 fixations per trial (on average) • 5 seconds (SD =7 sec) per trial • Mean fixation duration = 212 ms (SD = 89 ms) Focusing on the dynamic… • 10,215 fixations across complete search experiment.
Series of Fixation Differences (yn+1- yn)
Eye Fixations Scatter plot of 10,215 eye fixations for the entire visual search experiment.
Delay Plot of Fixations yn-vs- y n+1
Scaling across 8 sessions: Changes in fixation over time: • Frequency decreased from 1888 to 657 • Duration increased from 206 to 217 ms. • Position … • xn – xn+1 decreased • yn – yn+1 increased No typical scale!
Heavy-tail distributions • Power-laws • Small eye-mvmts are (very) common; large ones are rare! xn - x n+1
Visual search study • Power law results & implications* • Possible source of 1/f results:SOC, feedback NN models
PDF’s & Networks A. Kurakin
Brain network Edelman, G. & Tononi, G. (2000).A Universe of Consciousness: How Matter Becomes Imagination..
Spectral analysis Fast-Fourier Transform (FFT) Power vs. Frequency Regression slope = power exponent f a f -2 = 1/ f 2 Brown noise
Noisy time series White Pink Brown
“Color’ of noise 1/f 0 noise -- flat spectrum= no correlation across data points Short & Long range = 0 White Noise Pink Noise 1/f noise --shallow slope = subtle long range correlation 1/f 2 noise-- steep slope = Predictable long-range, ‘undulating’ correlation Short range = 0 (successive events uncorrelated) Brown Noise
PowerSpectra of raw fixations
Distance across eye fixations (x2 + y2) 1/2 = -.47
Distance across eye fixations (x2 + y2) 1/2 = -.47 = -0.3 = -1.8
Preliminary (FFT) results: • Sequence of… • Absolute eye positions --> 1/f brown noise • local random walk • Differences & distance-across-fixations--> ~1/f pink noise • Subtle long-term memory.
Power law (PDFs) & power spectra (FFT) indicates… • Memory (or filter) • Steepness of the slope (on a log-log scale) reflects.. • Correlation across data points = ‘Colored’ noise • Pink (1/f) • Brown (1/f^2) • Fractal properties: • Scale-free (means w/ measuring resolution) • Self-similar (statistically) • Critical + flexible + self-organizing (1/f)
Ongoing experiments: • Do power laws change under different conditions? • Structured vs. unstructured contexts? • Do power laws change as we learn? • What conditions produce 1/f pink noise? • Do 1/f patterns produce more effective search?
Overview • Visual search study • Dynamical tools • Power law results & implications • Possible source of 1/f resultsSOC,feedback & recurrent models
Source of 1/f dynamic? (Big controversy!)
Neural Network Models ~ Hebb (1969); Rummelhardt & McClelland (1985); Grossberg et al (2003);Koch & Itti (2001)Beggs & Plenz(2003); Maass, Joshi, & Sontag (2007) Neuronal interactions ---> implicit guidance Can eye movements be described by a simple set of neuronal interaction rules (e.g., SOC) to produce 1/f behavior?
Mainzer, K. (1997). Thinking in complexity: The complex dynamics of matter, mind & mankind. Berlin: Springer. Pg. 128
SOC Network(Adapted from Bak, Tang, & Wiesenfeld, 1987) 4 0 Increasing Neural Activation --->
SOC_2 • Stimulate 1 neuron
SOC_3 Z(x,y)= initially stimulated site Threshold rule: For Z(x,y) > Zcr =3 As individual neurons are activated beyond a threshold (of 3), activity (4) is dispersed to surrounding cells.
SOC_4 Z(x,y) -> Z(x,y) - 4 Activity in the original site is depleted to zero.
SOC_5 Z(x,y)-> Z(x,y) + 1 Surrounding activity increases by 1