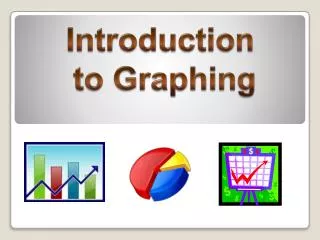
Choosing the Right Graph: Predicting Outcomes Through Data Visualization
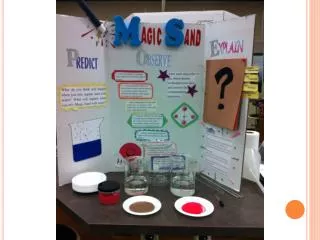
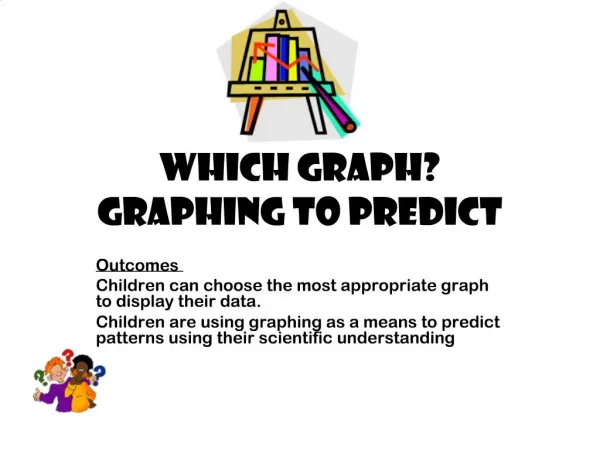
This educational activity empowers children to select the most suitable graph for displaying their data. By engaging with graphing techniques, students can predict outcomes and recognize patterns through scientific inquiry. Through hands-on experience, children enhance their understanding of data representation, gaining valuable skills in interpreting information visually. This activity supports critical thinking and fosters a deeper appreciation for the role of graphs in scientific analysis, making learning both interactive and informative.

Choosing the Right Graph: Predicting Outcomes Through Data Visualization
E N D
Presentation Transcript
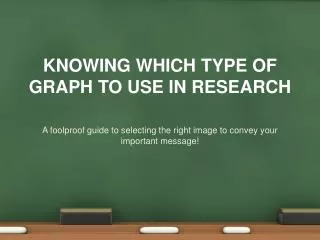
1. Which Graph? Graphing to predict Outcomes Children can choose the most appropriate graph to display their data. Children are using graphing as a means to predict patterns using their scientific understanding