r pole
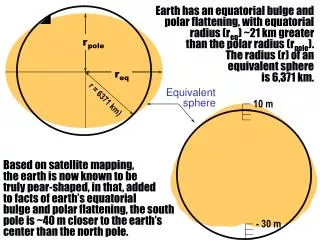
Earth has an equatorial bulge and polar flattening, with equatorial radius (r eq ) ~21 km greater than the polar radius (r pole ). The radius (r) of an equivalent sphere is 6,371 km. r pole. r eq. Equivalent sphere. r = 6371 km). 10 m. Based on satellite mapping,

r pole
E N D
Presentation Transcript
Earth has an equatorial bulge and polar flattening, with equatorial radius (req) ~21 km greater than the polar radius (rpole). The radius (r) of an equivalent sphere is 6,371 km. rpole req Equivalent sphere r = 6371 km) 10 m Based on satellite mapping, the earth is now known to be truly pear-shaped, in that, added to facts of earth’s equatorial bulge and polar flattening, the south pole is ~40 m closer to the earth’s center than the north pole. - 30 m
Whole earth density is twice the average density of surface rocks, i.e., density must increase with depths inside the earth.
Continental crust Oceanic crust 0 km Lithosphere 100 km 6371 km Mantle 200 km 2900 km 2250 km Inner core Outer core Mantle Earth is a multi-layered body. This is based on the following evidences: 1. seismic 2. gravity and 3. geomagnetic.
Whole Earth Earth’s Crust Universe HydrogenHelium Oxygen Carbon Nitrogen Silicon Neon Magnesium Iron Sulphur Aluminum Calcium Nickel Sodium Argon Chromium Phosphorous Manganese Chlorine Potassium Other elements HHe O C N Si Ne Mg Fe S Al Ca Ni Na Ar Cr P Mn Cl K 29.8 15.6 13.9 33.3 1.5 1.8 2.0 0.2 1.9 74.50023.840 0.8200 0.3750 0.0910 0.0830 0.0550 0.0570 0.1040 0.0380 0.0066 0.0074 0.0092 0.0033 0.0030 0.0032 0.0009 0.0011 0.0006 0.0003 46.6 27.7 2.1 5.0 8.1 3.6 2.8 2.6 1.5 The whole earth is richer in Fe, Mg and Ni, and poorer in Si, K and Al, than what is found on the earth’s surface. Crust Mantle Rocky Outer core Core Metallic Inner core Whole Earth density = 5.5 gm/cm3 Density of the crust = 2.7 gm/cm3
The damages from January 17, 1994, Northridge earthquake included 1. collapse of Northridge Meadows Apartments building that killed 16 people (one third of all the fatalities), 2. destruction of the parking garage at CSUN, and 3. damage to the overpasses of Interstate 5 near Castaic Junction
Surface Seismogram from station A S P Time since the earthquake occurred Surface S P Seismogram from station B
Time since the earthquake occurred (minutes) Distance from epicenter
P and S waves also yield information on the earth’s internal structure. The P-wave “shadow zone” extends from 103o to 142o from the hypocenter, for instance, . . . P wave shadow zone P wave shadow zone
. . . whereas the S-wave “shadow zone” extends beyond 103o from the hypocenter. Seismograms at stations 103o to 142o from the hypocenter thus receive no direct P or S waves from that earthquake. This occurs because the fluid outer core prevents S waves traversing through it and slows the P waves down. Outer core Inner core
Question Upsala (59o52’N:17o38’E), Sweden, is located 130.57o fromNorthridge (34o14’N:118o38’W), CA. Could we, then, have expected more reliable estimates of magnitude and related parameters for January 17, 1994, Northridge earth- quake from Upsala Seismological Observatory than from the U.S. Geological Survey at Denver, CO? Upsala 130o34’ Los Angeles
Earthquake fatalities from AD 1000 to 1988 Fatalities exceeding: Cities with population of 2 million by the year 2000 Convergent or transform plate boundaries 300,000 90,000 10,000
Crust Lithosphere Asthenosphere Seismic Wave Velocity 0 4 8 km/s km
Estimated increase in temperature with depth in the Earth, as inferred from studies of volcanoes, seismic wave velocities, laboratory experiments and theory*. Temperature (°K) Source: M.S.T. Bukowinski: Nature, Sept 30, 1999 pp. 432-433
Dinosaurs had dominated the Mesozoic life but vanished at the Cretaceous-Tertiary boundary without leaving any trace 0 Holocene Pleistocene Pliocene Miocene Oligocene Eocene Paleocene Quaternary 2 5 24 37 58 65 Cenozoic Tertiary Cretaceous Jurassic Triassic Permian Carboniferous Devonian Silurian Ordovician Cambrian 144 208 245 286 360 408 438 505 570 2500 3800 4700 Phanerozoic Meso-zoic Paleozoic Proterozoic Azoic or Archean Earth’s evolution
The lead-lead isochron for meteorites 40 30 4.54 Ga Pb207/Pb204 20 Pb207 Pb204 Pb206 Pb204 = (0.6128+0.014) + (4.46+0.10) 10 0 0 10 20 30 40 50 60 Pb206/Pb204
Ocean Storage 3 1,370,000,000 km Evaporation 60,000 km3 Precipitation 95,000 km3 Evaporation 320,000 km3 Precipitation 285,000 km3 Run-off: 35,000 km3 A conceptual look at the hydrological cycle