Download
1 / 33
330 likes | 450 Views
This report presents the analysis and evaluation of the searchCrystal prototype, focusing on visual information retrieval methodologies. It includes a task analysis, design approach, and user feedback from domain experts. The document details the principles of information visualization employed, alongside a comparative analysis of textual, icon graphical, and spring displays as per the methodologies explored in relevant literature. Furthermore, it discusses the correlation between overlap of search results and relevance, delving into authority and ranking effects, and their implications for user experience in information retrieval systems.

E N D
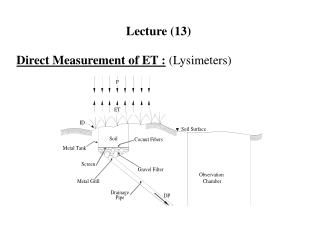
Lecture 13 • Housekeeping • Term Projects • Evaluations • Morse, E., Lewis, M., and Olsen, K. (2002) Testing Visual Information Retrieval Methodologies Case Study: Comparative Analysis of Textual, Icon Graphical and 'Spring' DisplaysJournal of the American Society for Information Scienceand Technology (JASIST) PDF • Reiterer H., Mußler G., Mann T.: Visual Information Retrieval for the WWW, in: Smith M.J. et al. (eds.), Usability Evaluation and Interface Design, Lawrence Erlbaum, 2001 PDF • searchCrystal Studies
Prototype Project • Motivate domain choice. • Perform task and need analysis. • Describe design approach and information visualization principles used. • Develop prototype. • Have an "domain expert" use the prototype and provide feedback. • Class PresentationYou have 15 min. to describe task analysis and your design approach.Demonstrate your prototype.Report on the "domain expert" feedback. • Create Report20 to 25 pages, written as a standard paper 10pt, double-spacedProvide screenshots of prototype and explain design approach.Include URL of prototype. • Hand-inHardcopy of report.Post report online and send instructor an email with the URL.
Text Retrieval Visualizations – Evaluations : Morse et al. • Many Tools Proposed • Few Tested and Often Inconclusive / Fare Poorly • Simplify Evaluation Focus on Method (instead of implementation) Only Static Aspects • POI = Point of Interest Visualizations • Position Coding • Glyph = Graphical Entity • Conveys data values via attributes such as shape, size, color
searchCrystal – Studies • Validate Design Approach • How does Overlap between Results Actually Correlate with Relevance? • User Study
Overlap between Search Results Correlated with Relevance? • Method • Use Ad-hoc track data for TREC 3, 6, 7, 8 • Systems search the SAME Database • Automatic Short Runs • 50 Topics and 1,000 Documents per topic 50,000 documents • Retrieval systems can submit multiple runs Select Best Run based Mean Average Precision TREC 319systems928,709documents found TREC 624systems1,192,557documents found TREC 728systems1,327,166documents found TREC 835systems1,723,929documents found • Compute Average by summing over all 50 topics and divide by 50
How does Overlap Correlate with Relevance? Percentage of Documents that are Relevant Systems Authority Effect
TREC 8 – Impact of Average Rank Position? • Compute overlap structure between top 50 search results of 35 random groupings of 5 retrieval systems for 50 topics. Percentage of Documents that are Relevant Systems Ranking Effect
searchCrystal – Studies • How does Overlap between Search Results Correlate with Relevance? • Authority Effect– the more systems that find a document, the greater the probability that it is relevant • Ranking Effect– the higher up a document in a ranked list and the more systems that find it, the greater the probability of its relevance • Validates searchCrystal’s Design Approach • searchCrystal Visualizes Authority & Ranking Effects • searchCrystal can Guide User’s Exploration Toward Relevant Documents
searchCrystal – Studies • Validate Design Approach • How does Overlap between Results Actually Correlate with Relevance? • User Study • http://www.scils.rutgers.edu/~aspoerri/study/UserStudy.swf
User Study – Compare Cluster Bull’s Eye and RankSpiral • Nine undergraduates. • Short Introduction and No Training. • Randomized presentation order of data sets and display type. • Subject selects ten document; • Visual feedback about correct top 10 • http://www.scils.rutgers.edu/~aspoerri/study/UserStudy.swf • Test for Cluster Bull’s Eye and RankSpiral displays: • 1) How well can novices use visual cues to find the documents that are most likely to be relevant? • 2) Performance difference in terms of effectiveness and/or efficiency? • 3) How much document’s distance from the display center will interfere with the size coding used to encode its probability of being relevant
User Study – Results • Hypothesis 1: “Novices can perform the task.” • Error is minimal for the top 7 documents and increases rapidly after the top 7 documents for both displays. • Novice users can use the Cluster Bulls-Eye and RankSpiral displays to select highly relevant documents, especially the top 7 documents. • Hypothesis 2: “RankSpiral outperforms Cluster Bulls-Eye.” • 8 of the 9 subjects performed the task faster using the RankSpiral. • Average time difference was 7.89 seconds. • The one-sided T-test value is 0.033, which is significant at the 0.05 level. • 7 out of 9 subjects performed the task more effectively using the RankSpiral. • Average “relevance score” difference is 0.034. • The one-sided T-test value is 0.037, which is significant at the 0.05 level. • Hypothesis 3: “Distance from center dominant cue.”
Discussion • Relax searchCrystal’s design principles? • Mapping documents found by the same number of engines into the same concentric ring. • Option: Distance and Size encode likelihood that a document is relevant. • Internet search results: • Concentric rings are of value, because it is much harder to estimate a document’s probability of being relevant.
searchCrystal - Studies • Authority & Ranking Effects Comparing Results of All Retrieval Systems at once Comparing Results of Random Subsets of Five Systems Validating searchCrystal’s Design Principles • User Study Identify Top 10 Docs in Cluster Bull’s Eye and RankSpiral • Novice Users can use the two searchCrystal displays • Statistical Difference between two displays • Distance from center is dominant visual feature
What is Popular on Wikipedia?Why? • Please read the two papers published by me in First Monday:http://www.firstmonday.org/ISSUES/issue12_4/ • Approach • 1 Visualize Popular Wikipedia Pages • Overlap between 100 Most Visited Pages on Wikipedia for September 2006 to January 2007 • Information Visualization helps to gain quick insights • 2 Categorize Popular Wikipedia Pages • 3 Examine Popular Search Queries • 4 Determine Search Result Position of Popular Wikipedia pages • 5 Implications