
Uploaded by
adanna
1 SLIDES
137 VIEWS
10LIKES
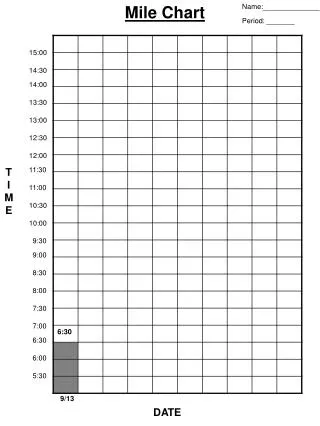
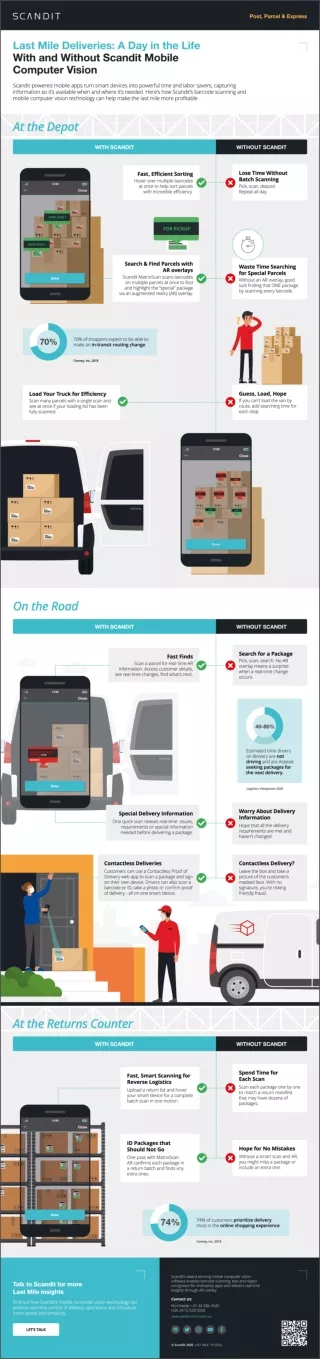
Time Series Data Visualization: Hourly Breakdown from 9:00 AM to 3:00 PM
DESCRIPTION
This time series dataset provides a detailed hourly breakdown from 9:00 AM to 3:00 PM on September 13, showcasing key metrics over the specified period. It includes time stamps at half-hour intervals, offering insights into trends and changes throughout the day. Analyzing this data can help identify patterns, performance fluctuations, and opportunities for improvement. Suitable for business analysts and performance measurement specialists looking to enhance data-driven decision-making.
Download
1 / 1
Download Presentation 
Time Series Data Visualization: Hourly Breakdown from 9:00 AM to 3:00 PM
An Image/Link below is provided (as is) to download presentation
Download Policy: Content on the Website is provided to you AS IS for your information and personal use and may not be sold / licensed / shared on other websites without getting consent from its author.
Content is provided to you AS IS for your information and personal use only.
Download presentation by click this link.
While downloading, if for some reason you are not able to download a presentation, the publisher may have deleted the file from their server.
During download, if you can't get a presentation, the file might be deleted by the publisher.
E N D
Presentation Transcript
Mile Chart Name: Period: 15:00 14:30 14:00 13:30 13:00 12:30 12:00 TIME 11:30 11:00 10:30 10:00 9:30 9:00 8:30 8:00 7:30 7:00 6:30 6:00 5:30 9/13 DATE


More Related