Download
1 / 14
140 likes | 252 Views
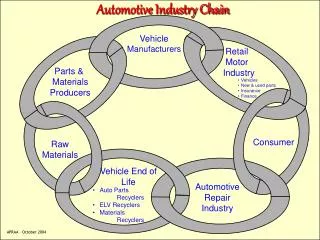
Car industry crash & vehicle shipping market foundering. ”Crash boom bang”. Agenda. Status right now Background and LV forecasts Supply of ships The balance Conclusions. Port calls –rapid decline. Ships laying idle. Production of cars, per region. Sales of cars, per region.

E N D
Car industry crash & vehicle shipping market foundering ”Crash boom bang”
Agenda • Status right now • Background and LV forecasts • Supply of ships • The balance • Conclusions
Production – sales, per region + 100% in 7 years !!
Ordering behavior, 1970 - 2008 1999-2003 191 ships avg: 4,764 ceu 2004-2008 451 ships Avg: 5,307 ceu
9.3% pa 2004-2008 Vehicle carrier fleet changes (register data) Orderbook 1.2M ceu = 38% fleet
5.3% forecast 2009-2013 Vehicle carrier fleet forecast 2004-2008 Fleet growth 9.3 % yearly FORECAST 2009-2013 Removals 647k ceu (+1,575%)
Vehicle carrier, Supply vs Demand,the Asia Indicator The Asia Indicator illustrates the base demand for vehicle carriers capacity over time +18% +15% -32%
Vehicle carrier, Supply vs Demand,the Asia Indicator, seaborne tonnes cars
Conclusions • Average annual net fleet capacity growth 2009-2013: 5.3% • Average annual demand growth 2009-2013: 2.9% • Vehicle carriers (and terminals) under threat from containerization • Can take cargo from conventional roro and general cargo • Turning point: Late-2010 for cars, earlier for project cargoes – modest levels to 2013
Thank you! Niklas Bengtsson Niklas.bengtsson@lrfairplay.com