The Simple Regression Model
The Simple Regression Model y = b 0 + b 1 x + u Some Terminology In the simple linear regression model, where y = b 0 + b 1 x + u , we typically refer to y as the Dependent Variable, or Left-Hand Side Variable, or Explained Variable, or Regressand Some Terminology, cont.


The Simple Regression Model
E N D
Presentation Transcript
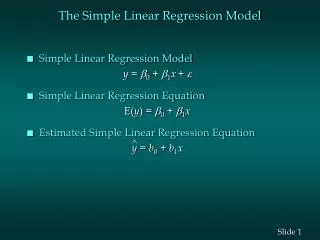
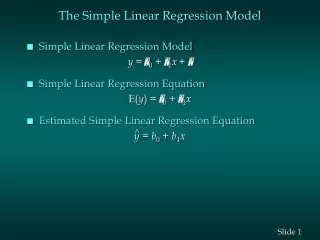
The Simple Regression Model y = b0 + b1x + u
Some Terminology • In the simple linear regression model, where y = b0 + b1x + u, we typically refer to y as the • Dependent Variable, or • Left-Hand Side Variable, or • Explained Variable, or • Regressand
Some Terminology, cont. • In the simple linear regression of y on x, we typically refer to x as the • Independent Variable, or • Right-Hand Side Variable, or • Explanatory Variable, or • Regressor, or • Covariate, or • Control Variables
A Simple Assumption • The average value of u, the error term, in the population is 0. That is, • E(u) = 0 • This is not a restrictive assumption, since we can always use b0to normalize E(u) to 0
Zero Conditional Mean • We need to make a crucial assumption about how u and x are related • We want it to be the case that knowing something about x does not give us any information about u, so that they are completely unrelated. That is, that • E(u|x) = E(u) = 0, which implies • E(y|x) = b0 + b1x
E(y|x) as a linear function of x, where for any x the distribution of y is centered about E(y|x) y f(y) . E(y|x) = b0 + b1x . x1 x2
Ordinary Least Squares • Basic idea of regression is to estimate the population parameters from a sample • Let {(xi,yi): i=1, …,n} denote a random sample of size n from the population • For each observation in this sample, it will be the case that • yi = b0 + b1xi + ui
Population regression line, sample data points and the associated error terms y E(y|x) = b0 + b1x . y4 { u4 . u3 y3 } . y2 u2 { u1 . } y1 x2 x1 x4 x3 x
Deriving OLS Estimates • To derive the OLS estimates we need to realize that our main assumption of E(u|x) = E(u) = 0 also implies that • Cov(x,u) = E(xu) = 0 • Why? Remember from basic probability that Cov(X,Y) = E(XY) – E(X)E(Y)
Deriving OLS continued • We can write our 2 restrictions just in terms of x, y, b0 and b1 , since u = y – b0 – b1x • E(y – b0 – b1x) = 0 • E[x(y – b0 – b1x)] = 0 • These are called moment restrictions
Deriving OLS using M.O.M. • The method of moments approach to estimation implies imposing the population moment restrictions on the sample moments • What does this mean? Recall that for E(X), the mean of a population distribution, a sample estimator of E(X) is simply the arithmetic mean of the sample
More Derivation of OLS • We want to choose values of the parameters that will ensure that the sample versions of our moment restrictions are true • The sample versions are as follows:
More Derivation of OLS • Given the definition of a sample mean, and properties of summation, we can rewrite the first condition as follows
Summary of OLS slope estimate • The slope estimate is the sample covariance between x and y divided by the sample variance of x • If x and y are positively correlated, the slope will be positive • If x and y are negatively correlated, the slope will be negative • Only need x to vary in our sample
More OLS • Intuitively, OLS is fitting a line through the sample points such that the sum of squared residuals is as small as possible, hence the term least squares • The residual, û, is an estimate of the error term, u, and is the difference between the fitted line (sample regression function) and the sample point
Sample regression line, sample data points and the associated estimated error terms y . y4 { û4 . û3 y3 } . y2 û2 { û1 } . y1 x2 x1 x4 x3 x
Alternate approach to derivation • Given the intuitive idea of fitting a line, we can set up a formal minimization problem • That is, we want to choose our parameters such that we minimize the following:
Alternate approach, continued • If one uses calculus to solve the minimization problem for the two parameters you obtain the following first order conditions, which are the same as we obtained before, multiplied by n
Algebraic Properties of OLS • The sum of the OLS residuals is zero • Thus, the sample average of the OLS residuals is zero as well • The sample covariance between the regressors and the OLS residuals is zero • The OLS regression line always goes through the mean of the sample
Goodness-of-Fit • How do we think about how well our sample regression line fits our sample data? • Can compute the fraction of the total sum of squares (SST) that is explained by the model, call this the R-squared of regression • R2 = SSE/SST = 1 – SSR/SST
Using Stata for OLS regressions • Now that we’ve derived the formula for calculating the OLS estimates of our parameters, you’ll be happy to know you don’t have to compute them by hand • Regressions in Stata are very simple, to run the regression of y on x, just type • reg y x
Unbiasedness of OLS • Assume the population model is linear in parameters as y = b0 + b1x + u • Assume we can use a random sample of size n, {(xi, yi): i=1, 2, …, n}, from the population model. Thus we can write the sample model yi = b0 + b1xi + ui • Assume E(u|x) = 0 and thus E(ui|xi) = 0 • Assume there is variation in the xi
Unbiasedness of OLS (cont) • In order to think about unbiasedness, we need to rewrite our estimator in terms of the population parameter • Start with a simple rewrite of the formula as
Unbiasedness Summary • The OLS estimates of b1 and b0 are unbiased • Proof of unbiasedness depends on our 4 assumptions – if any assumption fails, then OLS is not necessarily unbiased • Remember unbiasedness is a description of the estimator – in a given sample we may be “near” or “far” from the true parameter
Variance of the OLS Estimators • Now we know that the sampling distribution of our estimate is centered around the true parameter • Want to think about how spread out this distribution is • Much easier to think about this variance under an additional assumption, so • Assume Var(u|x) = s2 (Homoskedasticity)
Variance of OLS (cont) • Var(u|x) = E(u2|x)-[E(u|x)]2 • E(u|x) = 0, so s2= E(u2|x) = E(u2) = Var(u) • Thus s2 is also the unconditional variance, called the error variance • s, the square root of the error variance is called the standard deviation of the error • Can say: E(y|x)=b0 + b1x and Var(y|x) = s2
Homoskedastic Case y f(y|x) . E(y|x) = b0 + b1x . x1 x2
Heteroskedastic Case f(y|x) y . . E(y|x) = b0 + b1x . x1 x2 x3 x
Variance of OLS Summary • The larger the error variance, s2, the larger the variance of the slope estimate • The larger the variability in the xi, the smaller the variance of the slope estimate • As a result, a larger sample size should decrease the variance of the slope estimate • Problem that the error variance is unknown
Estimating the Error Variance • We don’t know what the error variance, s2, is, because we don’t observe the errors, ui • What we observe are the residuals, ûi • We can use the residuals to form an estimate of the error variance