Graphics Performance: Balancing the Rendering Pipeline
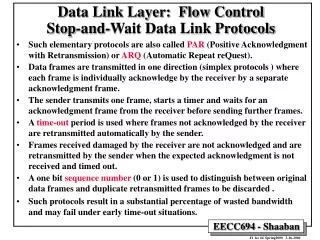
Graphics Performance: Balancing the Rendering Pipeline Cem Cebenoyan and Matthias Wloka Introduction At a minimum, PC is a 2 processor system CPU GPU Maximum efficiency IFF All processors are busy All the time GPU CPU AGP Bus Actually, It’s Worse GPU Vertex Processing CPU AGP Bus

Graphics Performance: Balancing the Rendering Pipeline
E N D
Presentation Transcript
Graphics Performance: Balancing the Rendering Pipeline CemCebenoyan and Matthias Wloka
Introduction • At a minimum, PC is a 2 processor system • CPU • GPU • Maximum efficiency IFF • All processors are busy • All the time GPU CPU AGP Bus
Actually, It’s Worse GPU Vertex Processing CPU AGP Bus Application Triangle Setup API Large Cache Fragment Shading Framebuffer Access
Multi-Processor System • Conceptually, 5 processors • CPU • Vertex-processor(s) • Setup processor(s) • Fragment processor(s) • Blending processor(s) • All connected via some form of cache • To smooth data flow • To keep things humming
MP Systems Become Inefficient If… • One or more processors sync to each other • For example, frame-buffer lock • Insures that all caches drain • Insures that all processors idle (CPU and GPU!) • Overhead in restarting the processors • A single processor bottlenecks all others
Overview • CPU • AGP Bus • Vertex Processing • Triangle Setup • Rasterization • Memory bandwidth • Writing to and blending with video memory
Overview: For Each Stage • What are its characteristics? • How does it behave? • How to measure whether it is the bottleneck • How to influence it
CPU Characteristics • Stay within on-chip cache for maximum performance • Use CPU for • Collision detection • Physics • AI • Etc.
CPU Characteristics (cont.) • Note that graphics is capable of • 20+ MTri/s (2 year old high-end) • 20+ MTri/s (integrated graphics) • 100+ MTri/s (current high-end) • CPU also responsible for pushing data to GPU • Cannot look at every triangle • Don’t limit graphics with CPU processing
CPU Measurement • Use VTune • Or any other profiler • Most games are CPU-limited • Little to no time in the graphics driver: • CPU is the bottleneck • Faster GPU will NOT result in faster graphics • Use VTune to track where you spend your time • Optimize those places
CPU Measurement (cont.) • But even if most time is spent in graphics driver: • CPU might still be the bottleneck • Faster GPU will NOT result in faster graphics • Use Nvidia Stats-driver (NVTune) to trace into the GPU • Timing graphics calls is pointless • Remember the large cache between CPU/GPU • Use Nvidia Stats-driver (NVTune) instead • NVTune available from Nvidia’s registered developer site
CPU Common Problems • Small batches of geometry being sent to the GPU • 100 triangles per batch should be your minimum • Would like to see ~500 triangles/batch • Up to 10,000 triangles/batch • Combination of causes kill your performance • Runtime • Driver • Hardware
CPU: Batching Solutions • Sort by render-state • Texture switches • Combine textures into one large (4kx4k) texture • Modify uv-coordinates accordingly • Tessellate geometry to overcome mirroring and wrapping • Mip-mapping works just fine • Transform switches • Pre-transform on the CPU into world-space • Replicate data into VBs (costs AGP memory)
Other Common CPU Problems • Specify vertex buffers as WRITEONLY • Minimize state changes • consider using a PURE device, iff you are optimal • Do not lock and read data from GPU • Multi-processor sync!
AGP Bus Characteristics • AGP 4x supports 20+ MTri/s • Even if all vertices and indices are dynamic • BenMark5 does just that • http://developer.nvidia.com/view.asp?IO=BenMark5 • Too often AGP 4x support is busted • Use BenMark5 to test for AGP 4x support • AGP Bus through-put influenced by • Size of vertex format of dynamically written vertices • How many vertices are dynamically written
AGP Bus Characteristics (cont.) • But if frame-buffer and textures exceed video-memory, AGP is also used • to transfer STATIC vertices to GPU every frame • to transfer textures to GPU every frame • Make sure you avoid partial writes • See “Fast AGP Writes for Dynamic Vertex Data” by Dean Macri for details • Always modify all vertex-data, • even if only some data changes • Pentium 3: write in 32 byte chunks • Pentium 4: write in 64 byte chunks
AGP Bus Characteristics (cont.) • GPU caches vertex fetches • Hitting this cache causes no data to cross the bus • Cache has 32-byte lines • Vertex sizes that are multiples of 32 are beneficial • See also http://developer.nvidia.com/view.asp?IO=Vertex_Buffer_Statistics
AGP Bus Measurement • You can tell you’re bound by the bus if: • Increasing/decreasing vertex format size significantly impacts performance • Best to increase vertex format size using components not needed by rasterizer • for example, normals
Increasing AGP Bus Performance • Make sure frame buffer and textures fit into video-memory • Decrease number of dynamic objects (vertices) • Use vertex-shaders to animate static VBs! • Decrease vertex size • Let vertex-shader generate vertex-components! • Compress components and use vertex shader to decompress • For example, use 16bit short normals • Reorder vertices in VB to be sequential in use • Can use NVTriStrip to do this • Pad to multiples of 32-bytes
Vertex Processing Characteristics • Each vertex is transformed and lit • Performance correlates directly to • Number of vertices processed • Length of vertex shader or • Fixed-function factors, such as • Number of active lights • Type of lights • Specular on/off • LOCALVIEWER on/off • Texgen on/off • GPU core clock frequency
Vertex Processing Characteristics • After processing, vertices land in post-TnL FIFO • GeForce1/2/4 MX: effectively 10 entries • GeForce3/4 Ti: effectively 18 entries • Cache-hit saves: • all TnL work! • Everything before TnL in the pipeline • Only works with indexed primitives
Vertex Processing Performance • Do not be afraid to use triangles • Rarely the bottleneck • Even if it is, it would make us happy • A lot of vertex processing power available • 6 * 6 pixel-quad with 2 tris is not vertex bound • If you can tell an object is made from triangles, you are not using enough triangles • ~10k triangles/frame is off by 2 (two!) orders of magnitude
Code Creatures Demo • Grass scenes are NOT vertex-bound • In excess of 1,000,000 tris/frame for opening scene • ~250k tris/frame minimum • CodeCreatures demo available from: http://www.codecult.de/
Vertex Processing Measurement • You are bound by vertex processing if: • Increasing/decreasing vertex shader length significantly influences performance • Adding unnecessary instructions may be optimized out by driver, though • Instead, use instructions that access constant memory to add zero to a result, for example • Fixed-function TnL performance improves when • Reducing number of lights • Turning off texgen • Simplifying light types
Improving Vertex Processing • Optimize for the post-TnL vertex cache • Use indexed primitives • Access vertices mostly sequentially, revisiting only recently accessed vertices • Let NVTriStrip or ID3DXMesh do the work • Turn off unnecessary calculations • LOCALVIEWER often unnecessary for specular • Prefer cheap approximations for lighting and other math when using vertex shaders
Improving Vertex Processing (cont.) • Optimize your vertex shaders • Use swizzling/masking extensively • Question all MOV instructions • Storing lookup tables in constant memory • for example, to compute sin/cos • See “Implementation of ‘Missing’ Vertex Shader Instructions” for more ideas • http://developer.nvidia.com/view.asp?IO=Implementation_Missing_Instructions
Improving Vertex Processing (cont.) • Consider moving per-vertex work to per-pixel • Consider using ‘shader-LODing’ • Do far-away objects really need 4-bone skinning? • Can always increase screen-res/use AA to NOT be vertex-processing bound!
Triangle Setup Characteristics • Triangle setup is never the bottleneck • Except when rating the GPU • Since it is the fastest stage • Setup speed influenced by: • Number of triangles • Vertex attributes needed by rasterization • Extremely small triangles running very simple TnL • i.e., degenerate triangles! • No TnL cost, since most likely hits post-TnL cache • No fill-cost, since rejected in setup
Measuring/Improving Triangle Setup • Has never come up • Reduce ratio of degenerate triangles to real triangles • Reduce unnecessary components written out from the vertex shader
Rasterization Characteristics • Prefer the term “fragment” to “pixel” • May not correspond to any pixel in framebuffer, for example, due to z/stencil/alpha tests • May correspond to more than one pixel due to multisampling • Commonly referred to as “fill-rate”
Fill-Rate Characteristics • Fill-rate is function of • number of fragments filled • cost of each fragment • GPU’s core clock • Parallel SIMD operation, processes • Up to 4 pixels per clock on GeForce1/2/3/4 Ti • Up to 2 pixels per clock on GeForce2 MX / 4 MX • Broken into a number of parts: • Texture fetching • Texture addressing operations • Color blending operations
Texture Fetching Characteristics • Texture fetches are • From AGP to local video-memory, only if frame-buffer and textures exceed video-memory (to be avoided), then • From local video-memory to on-chip cache
Texture Fetching Characteristics (cont.) • Minimize cache-misses: • Use mip-mapping! • Avoid LOD bias to sharpen: it hurts caching and adds aliasing • Prefer anisotropic filtering for sharpening • Use DXT everywhere you can • Texture size as big as needed and no bigger • Texture format as small as possible • 16 vs. 32 bit • Localize texture access • E.g., normal texture reads • Dependent texture reads are less local • Per-pixel reflection potentially really bad
Texture Fetching Characteristics (cont.) • Number of samples taken also affects performance: • Trilinear filtering cuts fillrate in half • Anisotropic even worse • Depending on level of anisotropy • The hardware is intelligent in this regard, you only pay for the anisotropy you use
Texture Addressing Characteristics • Different texture addressing operations have wildly different performance characteristics • But texture cache hits/misses more significant
Texture Addressing Characteristics • Also, every two textures cuts fill-rate in half: • 1 or 2 textures runs at full speed • 3 or 4 textures runs at half speed (two clocks)
Color Blending Characteristics • Color blending operations also called ‘Register Combiners’ • 1 or 2 instructions (combiners) – full speed • 3 or 4 instructions (combiners) – half speed • 5 or 6 instructions (combiners) – one third speed • 7 or 8 instructions (combiners) – one quarter speed • These numbers are for GF3 / 4 Ti • But if using 4 textures • Already at half-speed or less • Using up to 4 combiners is free
Fill-Rate Measurement • You are bound by fill-rate, if • Reducing texture sizes • Or better turning off texturing • Increases performance significantly • Turning on / off trilinear affects performance • Increasing texture units used to 4, but not actually fetching from any textures (using pixel shader instructions like texcoord), causes you to slow down
Improving Fill-Rate • Render z-only pass first • Because z-optimizations happen before rasterization • Helps with memory bandwidth as well • Even for older chips without z-optimizations • Do everything to reduce texture cache misses • Turn on anisotropic, but turn off trilinear filtering • Mip-map transitions are less visible with anisotropic filtering on
Improving Fill-Rate (cont.) • Consider palletized normal maps for compression • Consider moving per-pixel work to per-vertex • Consider ‘shader LODing’ • Turn off detail map computations in the distance
Memory Bandwidth Characteristics • Memory bandwidth is often the bottleneck • especially at high resolutions • Memory bandwidth influenced by: • Screen and render-target resolutions • Render-target color / z bit depth • FSAA • Texture sizes and formats (texture fetching) • Overdraw complexity • Alpha blending • GPU’s memory-interface width • Memory clock
Memory Bandwidth Characteristics • FSAA hits memory bandwidth exclusively • no fill-rate hit with multi-sample • Failing the z/stencil/alpha test means • Pixel color is not written • Z is not written
Measuring Memory Bandwidth • Switch frame-buffer format to 16bit • Switch all render-targets to 16bit • If performance doubles • App was 100% memory-bandwidth bound • If performance unchanged • App is not memory-bandwidth bound
Improving Memory Bandwidth • Overdraw • Reduce as much as possible • Lightly sort objects front to back • All architectures benefit, since z-test fails • Reduce blending as much as possible • Always enable alpha-test when blending • Tweak test-value as much as possible • Consider using 2-pass alpha-test/-blend technique • Always clear z/stencil (using clear()) • Do not clear color if not necessary • Writing z from shader destroys early z
Improving Memory Bandwidth (cont.) • Prefer FSAA over high resolution • Consider using z-only pass • Turn off z-writing for all subsequent passes
Conclusion • A lot of different performance bottle-necks • Know which one to tweak • Use suggestions here to • make things faster w/o making it visibly worse • Make things prettier for free!
Questions… ? cem@nvidia.com mwloka@nvidia.com http://developer.nvidia.com