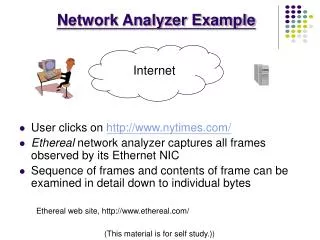
How to Use a Network Analyzer
How to Use a Network Analyzer. Last Update 2007.06.08 1.4.0. What Will Be Learned. How to use the most basic troubleshooting and analysis tool The network analyzer. Equipment. This lab is best with both of these

How to Use a Network Analyzer
E N D
Presentation Transcript
How to Use aNetwork Analyzer Last Update 2007.06.08 1.4.0 Copyright 2000-2007 Kenneth M. Chipps Ph.D. www.chipps.com
What Will Be Learned • How to use the most basic troubleshooting and analysis tool • The network analyzer Copyright 2000-2007 Kenneth M. Chipps Ph.D. www.chipps.com
Equipment • This lab is best with both of these • PC with promiscuous mode NIC, a driver for the NIC as specified by the network analyzer manufacturer, and an operating system installed • Access to a hub based network Copyright 2000-2007 Kenneth M. Chipps Ph.D. www.chipps.com
Equipment • This lab only can work with either of these instead • PC with any NIC, any driver, and an operating system installed • Access to a switch based network through a spanned port Copyright 2000-2007 Kenneth M. Chipps Ph.D. www.chipps.com
Connect to the Network • Drivers for Ethernet NICs are designed to see all traffic • However they ignore all unicast traffic that is not addressed to them by MAC address • To overcome this the driver for the NIC must be set to promiscuous mode • In such a mode it sees all traffic Copyright 2000-2007 Kenneth M. Chipps Ph.D. www.chipps.com
Connect to the Network • A NIC with a card that can be set to promiscuous mode is required for this lab, otherwise the card will see only traffic addressed to itself • In general most NICs can be set this way by the network analyzer program Copyright 2000-2007 Kenneth M. Chipps Ph.D. www.chipps.com
Connect to the Network • A connection issue related to the NIC is whether the driver will capture all of the errors on the network • This does not relate to promiscuous mode, but rather to the way the driver is written • In general these drivers are only available from the manufacturer of the network analyzer software Copyright 2000-2007 Kenneth M. Chipps Ph.D. www.chipps.com
Connect to the Network • Be sure that you have a NIC that the supplier of the analyzer has a driver for • If such a driver is not available the analyzer will still work, but it will miss the error packets Copyright 2000-2007 Kenneth M. Chipps Ph.D. www.chipps.com
Connect to the Network • Once the NIC in the computer is set to promiscuous mode it will read in all traffic sent across the network as long as it is connected to a hub • As in Copyright 2000-2007 Kenneth M. Chipps Ph.D. www.chipps.com
Connect to the Network Copyright 2000-2007 Kenneth M. Chipps Ph.D. www.chipps.com
Connect to the Network • To analyze the local traffic of a switch based network is more difficult because after a switch learns a MAC address on a port, it forwards traffic for this MAC address directly to the corresponding port • On a switch, after host B's MAC address is learned, unicast traffic from A to B is only forwarded to B's port, and therefore not seen by the sniffer Copyright 2000-2007 Kenneth M. Chipps Ph.D. www.chipps.com
Connect to the Network Copyright 2000-2007 Kenneth M. Chipps Ph.D. www.chipps.com
Connect to the Network • To watch traffic on a switch based network, plug the cable from the computer running the analyzer software into any standard port on the switch • Then set the switch port to span or monitor mode Copyright 2000-2007 Kenneth M. Chipps Ph.D. www.chipps.com
Connect to the Network • In such a mode instead of the port just seeing the traffic directed to the MAC address of the computer on that port, the broadcast traffic, and the multicast traffic; by spanning the port, this port will see all traffic on the local network • As in Copyright 2000-2007 Kenneth M. Chipps Ph.D. www.chipps.com
Connect to the Network Copyright 2000-2007 Kenneth M. Chipps Ph.D. www.chipps.com
Connect to the Network • For example on the Cisco Catalyst 2950 switch the Switched Port Analyzer or SPAN feature, also called port mirroring or port monitoring, selects network traffic for analysis by a network analyzer • This is called creating a Span port Copyright 2000-2007 Kenneth M. Chipps Ph.D. www.chipps.com
Connect to the Network • The Catalyst 2950 Switches can have only one SPAN session active at a time and can monitor only source ports, it can not monitor VLANs Copyright 2000-2007 Kenneth M. Chipps Ph.D. www.chipps.com
Connect to the Network • To create such a port, access the command line interface for the operating system then enter • C2950#config t • C2950(config)#monitor session 1 source interface fastEthernet 0/2 • !-- Interface fa 0/2 is configured as source port Copyright 2000-2007 Kenneth M. Chipps Ph.D. www.chipps.com
Connect to the Network • C2950(config)#monitor session 1 destination interface fastEthernet 0/3 • !-- Interface fa0/3 is configured as destination port • C2950(config)#Ctrl Z • To check this enter • C2950#show monitor session 1 • Session 1 • --------- Copyright 2000-2007 Kenneth M. Chipps Ph.D. www.chipps.com
Connect to the Network • Source Ports: • RX Only: None • TX Only: None • Both: Fa0/2 • Destination Ports: Fa0/3 • To clear this • C2950#config t • C2950#no monitor session session 1 Copyright 2000-2007 Kenneth M. Chipps Ph.D. www.chipps.com
Connect to the Network • Catalyst 2950 Switches are able to SPAN source port traffic in the • Receive direction only - Rx span or ingress span • Transmit direction only - Tx span or egress span • Both directions Copyright 2000-2007 Kenneth M. Chipps Ph.D. www.chipps.com
Connect to the Network • Keep in mind the way most switches work these days in that if the switch receives a corrupted packet, the ingress port usually drops it, so you won't see it on the egress port • It is then true that a switch is not completely transparent when it is a matter of capturing traffic Copyright 2000-2007 Kenneth M. Chipps Ph.D. www.chipps.com
Connect to the Network • So when you see a corrupted packet, the errors where generated on the egress segment Copyright 2000-2007 Kenneth M. Chipps Ph.D. www.chipps.com
What is a Network Analyzer • As Laura Chappell, a very well known writer and trainer on network analysis says • A network analyzer is a device (desktop, laptop or portable computer) that can 'capture' all the packets seen on the network and display them in the order they appeared on the cable • A good analyzer should have some alerts/alarms that notify you of unusual or faulty traffic patterns Copyright 2000-2007 Kenneth M. Chipps Ph.D. www.chipps.com
What is a Network Analyzer • The analyzer should also be able to build trend graphs to illustrate the current and long-term traffic patterns (such as utilization and packets per second) • In order to make the communications information useful to you, the analyzer decodes, or interprets, the actual packet information received Copyright 2000-2007 Kenneth M. Chipps Ph.D. www.chipps.com
What to Call These Things • Network analyzers go by many different names • Such as • Network Analyzer • Protocol Analyzer • Sniffer Copyright 2000-2007 Kenneth M. Chipps Ph.D. www.chipps.com
A Network Analyzer • Next we will go through the basics of what a network analyzer can do using screenshots and an explanation of each task • This example uses Sniffer Pro Version 4.5 • We will begin by looking at each button on the toolbar Copyright 2000-2007 Kenneth M. Chipps Ph.D. www.chipps.com
Opening Display Copyright 2000-2007 Kenneth M. Chipps Ph.D. www.chipps.com
Toolbar Buttons Copyright 2000-2007 Kenneth M. Chipps Ph.D. www.chipps.com
Toolbar Buttons Copyright 2000-2007 Kenneth M. Chipps Ph.D. www.chipps.com
Gauge Dashboard View • The normal opening view shows the dashboard • To make the dashboard appear click on the dashboard button on the toolbar Copyright 2000-2007 Kenneth M. Chipps Ph.D. www.chipps.com
Gauge Dashboard View Copyright 2000-2007 Kenneth M. Chipps Ph.D. www.chipps.com
Gauge Dashboard View • The dashboard is a set of gauges showing • Utilization • Packets per Second • Errors per Second • Below this is a line chart • Utilization is selected by default • Other lines can be added by checking the boxes Copyright 2000-2007 Kenneth M. Chipps Ph.D. www.chipps.com
Gauge Dashboard View Copyright 2000-2007 Kenneth M. Chipps Ph.D. www.chipps.com
Detail Dashboard View • The information seen in the gauges can be expanded to show more detail by clicking the Detail tab Copyright 2000-2007 Kenneth M. Chipps Ph.D. www.chipps.com
Detail Dashboard View Copyright 2000-2007 Kenneth M. Chipps Ph.D. www.chipps.com
Detail Dashboard View Copyright 2000-2007 Kenneth M. Chipps Ph.D. www.chipps.com
Gauge Threshold Settings • The two colors on the gauges represent the normal range – in black and the problem range – in red • These can be set to any level desired by clicking on the Set Thresholds button • And adjusting the values shown Copyright 2000-2007 Kenneth M. Chipps Ph.D. www.chipps.com
Gauge Threshold Settings Copyright 2000-2007 Kenneth M. Chipps Ph.D. www.chipps.com
Gauge Threshold Settings Copyright 2000-2007 Kenneth M. Chipps Ph.D. www.chipps.com
See All Devices on the Network • The network analyzer can be used to show all devices that are sending traffic over the network • This is done by clicking the Host Table button Copyright 2000-2007 Kenneth M. Chipps Ph.D. www.chipps.com
See All Devices on the Network Copyright 2000-2007 Kenneth M. Chipps Ph.D. www.chipps.com
See All Devices on the Network Copyright 2000-2007 Kenneth M. Chipps Ph.D. www.chipps.com
See All Devices on the Network • The devices can be listed by • MAC address • IP address Copyright 2000-2007 Kenneth M. Chipps Ph.D. www.chipps.com
See All Devices on the Network Copyright 2000-2007 Kenneth M. Chipps Ph.D. www.chipps.com
See All Devices on the Network Copyright 2000-2007 Kenneth M. Chipps Ph.D. www.chipps.com
See All Devices on the Network • The IP list shows local and remote devices, such as web sites viewed • This window has several other views that can be selected by clicking on the buttons on the left of the window Copyright 2000-2007 Kenneth M. Chipps Ph.D. www.chipps.com
See All Devices on the Network Copyright 2000-2007 Kenneth M. Chipps Ph.D. www.chipps.com
Traffic Map • The Traffic Map is an odd display • It is meant to show who is talking to who Copyright 2000-2007 Kenneth M. Chipps Ph.D. www.chipps.com
Traffic Map Copyright 2000-2007 Kenneth M. Chipps Ph.D. www.chipps.com