Conditional Distributions and the Bivariate Normal Distribution
Conditional Distributions and the Bivariate Normal Distribution. James H. Steiger. Overview. In this module, we have several goals: Introduce several technical terms Bivariate frequency distribution Marginal distribution Conditional distribution

Conditional Distributions and the Bivariate Normal Distribution
E N D
Presentation Transcript
Conditional Distributions and the Bivariate Normal Distribution James H. Steiger
Overview • In this module, we have several goals: • Introduce several technical terms • Bivariate frequency distribution • Marginal distribution • Conditional distribution • In connection with the bivariate normal distribution, discuss • Conditional distribution calculations • Regression toward the mean
Bivariate Frequency Distributions • So far, we have discussed univariate frequency distributions, which table or plot a set of values and their frequencies.
Bivariate Frequency Distributions • We need two dimensions to table or plot a univariate (1-variable) frequency distribution – one dimension for the value, one dimension for its frequency.
Bivariate Frequency Distributions • A bivariate frequency distribution presents in a table or plot pairs of values on two variables and their frequencies.
Bivariate Frequency Distributions • For example, suppose you throw two coins, X and Y, simultaneously and record the outcome as an ordered pair of values. Imagine that you threw the coin 8 times, and observed the following (1=Head, 0 = Tail)
Bivariate Frequency Distributions • To graph the bivariate distribution, you need a 3 dimensional plot, although this can be drawn in perspective in 2 dimensions
Marginal Distributions • The bivariate distribution of X and Y shows how they behave together. We may also be interested in how X and Y behave separately. We can obtain this information for either X or Y by collapsing (summing) over the opposite variable. For example:
Conditional Distributions • The conditional distribution of Y given X=a is the distribution of Y for only those occasions when X takes on the value a. • Example: The conditional distribution of Y given X=1 is obtained by extracting from the bivariate distribution only those pairs of scores where X=1, then tabulating the frequency distribution of Y on those occasions.
Conditional Distributions • The conditional distribution of Y given X=1 is:
Conditional Distributions • While marginal distributions are obtained from the bivariate by summing, conditional distributions are obtained by “making a cut” through the bivariate distribution.
Marginal, Conditional, and Bivariate Relative Frequencies • The notion of relative frequency generalizes easily to bivariate, marginal, and conditional probability distributions. In all cases, the frequencies are rescaled by dividing by the total number of observations in the current distribution table.
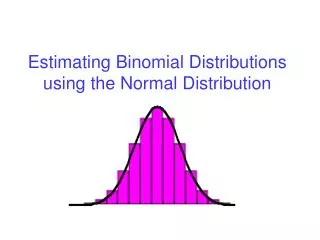
Bivariate Continuous Probability Distributions • With continuous distributions, we plot probability density. In this case, the resulting plot looks like a mountainous terrain, as probability density is registered on a third axis. The most famous bivariate continuous probability distribution is the bivariate normal. Glass and Hopkins discuss the properties of this distribution in some detail.
Bivariate Continuous Probability Distributions • Characteristics of the Bivariate Normal Distribution • Marginal Distributions are normal • Conditional Distributions are normal, with constant variance for any conditional value. • Let b and c be the slope and intercept of the linear regression line for predicting Y from X.
Computing Conditional Distributions • We simply use the formulas • We have two choices: • Process the entire problem in the original metric, or • Process in Z score form, then convert to the original metric.
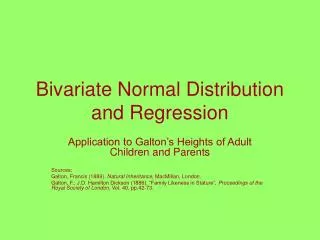
Conditional Distribution Problems • The distribution of IQ for women (X)and their daughters (Y) is bivariate normal, with the following characteristics: Both X and Y have means of 100 and standard deviations of 15. The correlation between X and Y is .60.
Conditional Distribution Problems • First we will process in the original metric. Here are some standard questions. What are the linear regression coefficients for predicting Y from X? They are
Conditional Distribution Problems • What is the distribution of IQ scores for women whose mothers had an IQ of 145? • The mean follows the linear regression rule: • The standard deviation is
Conditional Distribution Problems • What percentage of daughters of mothers with IQ scores of 145 will have an IQ at least as high as their mother?
Conditional Distribution Problems • We simply compute the probability of obtaining a score of 145 or higher in a normal distribution with a mean of 127 and a standard deviation of 12. We have:The area above 1.5 in the standard normal curve is 6.68%.
Conditional Distribution Problems • What are the social implications of this result?