Download
1 / 38
380 likes | 605 Views
Using Data to Know About and Tell Our 4-H Story. YouthFEST Plenary Session November 18, 2015 Phil Heckman, Sandra Burke, and Bailey Hanson. 4-H and Youth Extension Staff Survey Oct. 2015. 90 Respondents Thank You!!. Questions about Data on 6 Specific External Environs

E N D
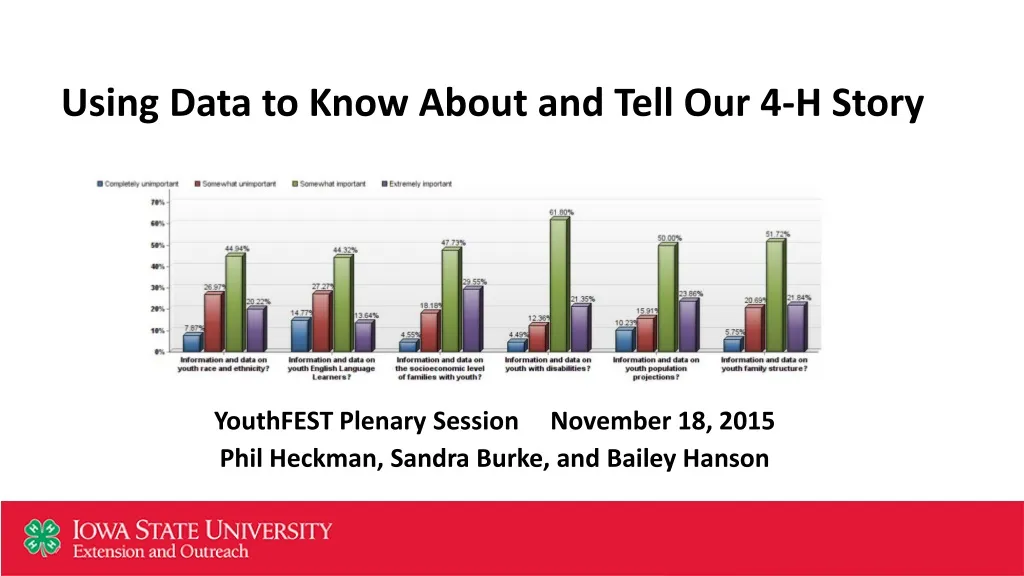
Using Data to Know About and Tell Our 4-H Story YouthFEST Plenary Session November 18, 2015 Phil Heckman, Sandra Burke, and Bailey Hanson
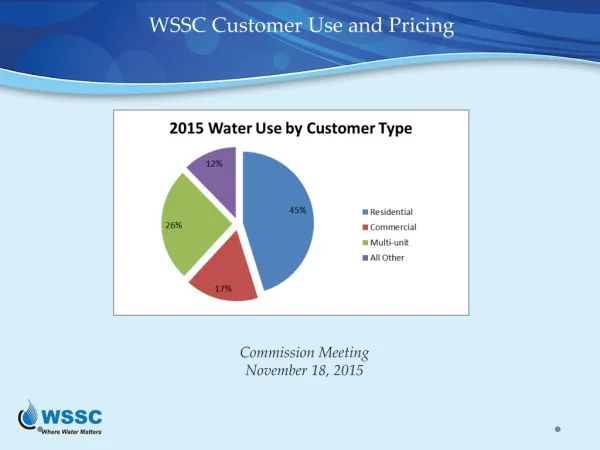
4-H and Youth Extension Staff Survey Oct. 2015 90 Respondents Thank You!! Questions about Data on 6 Specific External Environs • Youth race and ethnicity • Youth English Language Learners • Socioeconomic level of families with youth • Youth with disabilities • Youth population projections • Youth family structure Questions about Data on 3 Specific 4-H Internals • Youth participation in youth programs outside of 4-H • 4-H volunteers, types of volunteerism, and volunteer hours • Benefits and efficacy of the 4-H youth programs delivery modes
4-H and Youth Extension Staff Survey Oct. 2015 Asked 4 things about each of the 9 items • How often do you look for it? • How important is it for your work? • How important is it for community partners? • How important is it for the future of the 4-H Youth Development Program? Asked to write in what questions you had about each
What Did You Tell Us in the Survey? • Respondents look for data generally a few times a year • Overall, ALL the data and topics were considered important mean < 2.0 = unimportant mean = 2.3 = neutral mean > 2.5 = important means ranged 2.6 – 3.5
What Did You Tell Us in the Survey? • Overall, respondents report that these issues may have less importance to their community partners (i.e. somewhat lower means on importance) than they do for themselves in their current work. • Respondents rated the importance of these issues somewhat higher for the future of 4-H than for themselves in their current work. • Socio-Economic Status of Families, Youth with Disabilities, and Youth Population Projections tended to have the highest means for importance across the categories (your work, future of 4-H, and community partners).
What Did You Tell Us in the Survey? • While there are variations in reported importance by type of 4-H staff, all 4-H staff view these topics as important. Approximately 1/3 each: 2 years or less, 3-9 years, 10+ years 66% County Youth Coordinators
What Did You Tell Us in the Survey? Write-in responses What questions about ____________ would you like addressed? For each of the 9 topic areas
What Did You Tell Us in the Survey? Write-in types of responses about items • Specific types of Data items • Data collection processes from families, volunteers, and clients • Engaging, integrating, and facilitating participation with diverse groups • Fees and other barriers to participation • Best practices and programming for working with families across family types • Best practices and programming for youth with disabilities
What Did You Tell Us in the Survey? Write-in types of responses about items • Resources and training available for staff and volunteers • Language and translation issues, staff training for this • Marketing and promoting 4-H programs, recruiting youth • Recruiting volunteers • Research questions on delivery modes • Program sustainability in terms of budgets, competition, volunteers • Not applicable to work or area
What Did You Tell Us in the Survey? Broad categories of questions about items • Specific Data and data collection • Resources and training available for staff and volunteers • Best practices and programming across topics • Marketing and promoting 4-H programs, recruiting youth, volunteers • Research questions on delivery modes • Program sustainability in terms of budgets, competition, volunteers • Not applicable to work or area
Management Team/Work Domains Luann Johansen Vacant (John-Paul until hire) • Curriculum • Program Development • Materials • Trainings • Software Applications • Etc. • Youth Program Specialists • Support County Programs • Maintain quality and consistency across the state Jay Staker Keli Tallman • Volunteer • Development • Partnership • Development • Fundraising/Grant Writing • Communications/Branding Resource Development • Data & Enrollment • Evaluation • Budget • Equity and • Disproportionality • Civil Rights • Dept. Ed Data Accountability
What Did You Tell Us in the Survey? Broad categories of questions about items • Specific Data and data collection • Resources and training available for staff and volunteers • Best practices and programming across topics • Marketing and promoting 4-H programs, recruiting youth, volunteers • Research questions on delivery modes • Program sustainability in terms of budgets, competition, volunteers • Not applicable to work or area
What kinds of Data do we use? External Data: What environment are we living in? Internal Data: Is our House in order?
How do we use it? Data Points are facts, they are not good or bad, they exist to tell the story. In order to be relevant we need to make acomparison. We want our comparisons to mean something . How we compare the facts tells the story.
How do we use it? Here is an example: Jameson County Iowa had 300 4-H’ers enrolled last year. Is this relevant? Can you say anything definitive about the Jameson County 4-H program? Now when I Tell you that there were 350 4th-12th graders in Jameson County does that tell a story? What if I told you there were 30,000 4th-12th graders in Jameson County?
Using Data to Tell Our 4-H Story Mark Twain • American Story Teller • Mark Twain is actually a pseudonym that was a term for determining the depth of water. • Twain = Two (Never the twain shall meet). • mark twain literally means to mark two fathoms or 12 feet of good, safe, and navigable water.
Demographics and Trends • General Data on Race & EthnicityIowa 4-H Statistical Webpage: Achievement Gap Indicators by County DOE Data • Current TrendsIowa 4-H Statistical Webpage: Youth Population Projections by County with 4-H Participation Projections • Projected StatsIowa 4-H Statistical Webpage: Youth Population Projections by County with 4-H Participation Projections • Comparison of 4-H Numbers with Youth PopulationIowa 4-H Statistical Webpage: Youth Population Projections by County with 4-H Participation Projections • Numbers by Grade & Project Area • Iowa 4-H Statistical Webpage: 2014-15 Project enrollment by county • Spatial analysis of Clubs
English Language Learners • What language is primarily spoken • How many ELL Students are in a school District?Iowa 4-H Statistical Webpage: Achievement Gap Indicators by County DOE Data • Spatial analysis of ELL “Hot Spots” • Percentages of ELL youth in Iowa and each CountyIowa 4-H Statistical Webpage: Achievement Gap Indicators by County DOE Data
Socio Economic Status • Breakdown of socioeconomic Status of Families by county or even more specifically by areas of a countyIowa 4-H Statistical Webpage: Achievement Gap Indicators by County DOE Data • How does a given county rank?Iowa 4-H Statistical Webpage: Achievement Gap Indicators by County DOE Data • How many Youth are experiencing PovertyIowa 4-H Statistical Webpage: Achievement Gap Indicators by County DOE Data • Spatial analysis of Youth in Poverty • 4-H Program Participation by socioeconomic level • How do we gather this information from participants/Families
Youth With Disabilities • Define disabilities • Specific data about types of disabilities. • What percentage of students are classified as having multiple disabilities? • How do we identify youth with disabilities in our program?
Youth With Disabilities • Autism • Deaf-blindness • Deafness • Developmental delay • Emotional disturbance • Hearing impairment • Intellectual disability • Multiple disabilities • Orthopedic impairment • Other health impairment • Specific learning disability • Speech or language impairment • Traumatic brain injury • Visual impairment, including blindness • IDEA Act Sec. 300.8 Child with a disability
Youth With Disabilities • Define disabilitieshttp://idea.ed.gov/explore/view/p/,root,regs,300,A,300%252E8, • Specific data about types of disabilities • What percentage of students are classified as • having multiple disabilities? • How do we identify youth with disabilities in our program? • What percentages of youth in our county have disabilities? • Iowa 4-H Statistical Webpage: Achievement Gap Indicators by County DOE Data
Extra Curricular Youth Participation • Numbers and types of programs (youth development, • recreation, music, etc.) • What characteristics of outside programs are • offered that 4-H does not • What does the participation age curve look like in • other youth development programs? • Participation trends for other youth organizations
Family Structure • Ranges and number of family structureshttp://www.iowayouthsurvey.iowa.gov/trend_reports/index.html • How many youth are raised in different types of homes http://www.iowayouthsurvey.iowa.gov/trend_reports/index.html • Is there a connection between family structure • and other youth characteristics? http://www.iowayouthsurvey.iowa.gov/trend_reports/index.html • What does the family structure of 4-H participants look like?
Volunteers and Volunteerism • What volunteer opportunities exist in my county • Number of volunteers Hours of Service.State 4-H Statistical Page: Volunteers by County, 2009 Iowa Volunteer Impact Study • What are the demographics and careers of our volunteers? • Volunteer preferences in terms of ongoing/episodichttp://www.volunteeringinamerica.gov/IA (General statistics on volunteerism in Iowa from the Corporation for National and Community Service.) • Numbers of short term volunteers and numbers • of long term volunteers. State 4-H Statistical Page: Volunteers by County
4-H Statistical Webpage: https://www.extension.iastate.edu/4h/restrict/statisticals.htm
What you can find on the Indicators Portal • Data on many Topics and Subject Areas • Tools for Designing Graphs and Maps • Data for Decision Makers County and Region Profiles • Access to City Government Finance Data (IGFI) • Reports on Data Trends and Topics of Interest • Educational Materials on Data Measures and their Use VPEO Strategic Initiative
Step 1. Step 2: Login ISU Net-ID or guest account http://indicators.extension.iastate.edu Step 3: Choose Geography Settings
4-H Statistical Webpage: https://www.extension.iastate.edu/4h/restrict/statisticals.htm Phil Heckman pheckman@iastate.edu 515-294-9785 Indicators Portal Page: indicators.extension.iastate.edu Information email: indicators@iastate.edu Tweet to: @ISUExtensionIP Sandra Burke scburke@iastate.edu 515-294-9307 Bailey Hanson bahanson@iastate.edu 515-520-1436