Download
1 / 47
480 likes | 906 Views
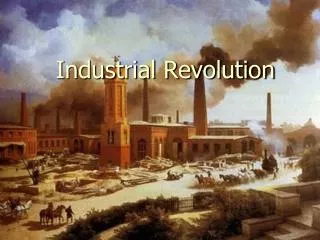
CAUSE 2003: From Industrial Revolution to… Industrial Ecology. with Amish, Eric, and Lauren. History of IE. Robert A. Frosch. Nicholas E. Gallopoulus . History of IE.

E N D
CAUSE 2003: From Industrial Revolution to…Industrial Ecology with Amish, Eric, and Lauren
History of IE Robert A. Frosch Nicholas E. Gallopoulus
History of IE • A system that "would maximize the economical use of waste materials and of products at the ends of their lives as inputs to other processes and industries."-Frosch, 1992 • Essentially mimics natural systems
Types of Industrial Ecosystems • Local, Regional, National, Global • Industrial Symbiosis • The Eco-Industrial Park
An Eco-Industrial Park in Devens, Massachusetts “We should leave to the next generation a stock of ‘quality of life’ assets no less than those we have inherited.” -Devens Enterprise Commission - Local opinion - Government action
Major Characteristics of the Devens Eco-Industrial Park • Material, water, and energy flows • Companies within close proximity • Strong informal ties between plant managers • Minor retrofitting of existing infrastructure • One or more anchor tenants.
Examples of IE Common Sense IE: Saving resources Recycling Be efficient when possible Why? Fewer resources consumed lower operational costs Less waste/trash lower disposal costs
Examples • Liberal plans • Using renewable resources • Wastes become new resources • Efficient production • Long-lasting design of systems
PSU Dining Commons • Computer software • Batch Cooking • Napkins
Kalundborg, Denmark • Industries exchange wastes • Companies made agreements 70s – 90s • Asnaes – Coal-fired power plant • Statoil – Oil Refinery • Gyproc – plasterboard company • Novo Nordisk – biotechnology company
Coal Power Plant • Inputs: • Coal • Surplus gas from nearby refinery • Cool Salt Water Products • Electricity • Steam + Heat • Hot Salt Water • Ash • Gypsum http://www.indigodev.com/Kal.html
Waste Gas Coal Power Plant Gypsum
Fuels Petroleum Gas Oil Refinery Steam Sulfur
Industrial Ecology in Kalundborg • Saves resources: • 30% better utilization of fuel using combined heat + power than producing separate • Reduced oil consumption • 3500 less oil-burning heaters in homes • Does not drain fresh water supplies • New source of raw materials • Gypsum, sulfuric acid, fertilizer, fish farm http://www.symbiosis.dk
1989 http://print.nap.edu/pdf/0309049377/pdf_image/77.pdf
Analysis of Lead, 1989, USA • % Lead consumed for batteries = 78% • In lead-acid batteries 700,000 tons out of 800,000 tons recycled, were re-processed and reused ~ (87%) http://books.nap.edu/books/0309049377/html/77.html#pagetop
~ 360,000 ~ 130,000 ~ 90,000 Smith, Gerald. “Lead Recycling in the United States in 1998”.
~ 880,000 ~ 1,420,000 ~ 1,000,000
Lead, 1998 • % Lead consumed for batteries = 88% • 95% recycling efficiency
Automobile IE • 65% of an automobile is comprised of iron and steel • In 2001, 15 million tons of iron and steel were recycled from automobiles • Can be used to produce 48 million steel utility poles http://www.recycle-steel.org/cars/main.html
From the Junkyard • Useable engines, tires, batteries, fluids, and other parts are removed for resale • The body is shipped to a scrap yard • Magnets separate iron/steels • Scrap metal is sent to steel mills • New car bodies are made with at least 25% recycled steel • Other parts such tires can be shredded and reused http://www.recycle-steel.org
Why Aluminum? • Can replace steel • Less dense than steel • Increased fuel economy due to lighter automobiles • Less emissions • rusting
Aluminum European Aluminum Assocation http://www.eaa.net/downloads/auto.pdf
Aluminum Production • Aluminum requires large amounts of energy to extract ~ 6 – 8 times more than steel • However, recyclable without much loss
Aluminum Cans • In 1998 879,000 metric tons of Aluminum cans were recycled (63% of all Al cans) • Cans comprise less than 30% of Al products • In 1998, 3.4 million metric tons of Aluminum were processed from recycled Aluminum (37%). http://www.aluminum.org/Template.cfm?Section=Recycling
Summary of Autos • Recycling steel and aluminum • Replacing steel with aluminum • Buying longer lasting automobiles with better fuel economy • Using alternate means of transportation
The Economics of Ecology (or…covering your bottom line) Pictures courtesy of http://pubs.wri.org/pubs_description.cfm?PubID=3786 and http://www.kbnp.com/bl.htm respectively.
Monterey Regional Waste Management District Regional Environmental Park • “Reduce, Reuse and Recycle” • Hazardous Waste Mitigation • Reselling materials instead of dumping • Landfill Gas Power Project
Cape Charles Sustainable Technology Park Create 400 Jobs in first stage of development for Local Area * 27% below poverty line Redevelop Brownfields Government Subsidy Natural Habitat and Infrastructure Solar Building Systems, Inc. Energy Recovery
Market FailureNegative Externalities • Harm proportionate with output produced • Harm increases at an increasing rate with output produced (synergistic effect) • Harm significant initially, increases at decreasing rate with output produced
Economic Benefits of IE • Hidden Resource Productivity Gains • Within Firm: eliminating waste • Making plant more efficient • Within Value Chain: reducing costs • Synergies between production and distribution • Beyond Production Chain: closed loop • Eco-Industrial Parks and inter-firm relations
Benefits of IE to Corporation • Revenue Generation • Cost Savings • Reduced Liabilities • Competitive Edge of Regulatory Flexibility • Enhanced Public Image • Market Leader
Barriers to Development • Suitability of materials to reuse • High cost of recycling (internalize negative externalities) • Information Barriers (must set up reciprocal relationships between sectors) • Organizational Obstacles • Institutional Barriers (need fiscal and regulatory government intervention)
Macro to Micro Scale of IE • Macro: Industrial Processes as a whole • Meso: Sector Interrelationships • Micro: Individual Consumer/Producer Behavior • “Conspicuous Consumption” and Conspicuous Waste Photo courtesy of: http://www.cpm.ehime-u.ac.jp/AkamacHomePage/Akamac_E-text_Links/Veblen.html
Jobs, Jobs, Jobs • "President Bush is committed to increasing the productivity and wealth of the American economy and to ensure that all regions, states, and communities share in economic opportunity.“ ~ David A. Sampson, Assistant Secretary of Commerce for Economic Development
References • http://www.is4ie.org//history.html • http://www.devensec.com/sustain.html