Download

1 / 26
260 likes | 367 Views
Trade and offer curves in the EU ref: offer curves v4. Introduction. Previously, we saw there are other reasons for forming a CU, beyond static effects (TC/TD) Dynamic effects Public goods argument Cooper & Massell (1965) Terms of Trade (ToT) effect – focus on this.

E N D
Introduction • Previously, we saw there are other reasons for forming a CU, beyond static effects (TC/TD) • Dynamic effects • Public goods argument Cooper & Massell (1965) • Terms of Trade (ToT) effect – focus on this
ToT important for a large CU • Improvement in ToT increases welfare • ToT - secondary objective • Any ToT gain transferred from rest of world - not wealth creating effect
A country’s offer curve (OC) shows the quantity that the country is willing to offer (export) in exchange for a given quantity of imports • Derived from PPCs & trade triangles – see below
General equilibrium analysis. Consider: • better than partial equilibrium analysis? • small country • large country • offer curves & CUs
Tariffs & offer curves: small country Imports of food (F) Exports of cloth (C)
Tariffs & offer curves: small country Imports of food (F) M OM = terms of trade (TOT). Unaffected by small country imposing tariffs O Exports of cloth (C)
OH = free trade OC Imports of food (F) H M O Exports of cloth (C)
Trade at point Q. OA are imports against exports. Imports of food (F) H M A Q O Exports of cloth (C)
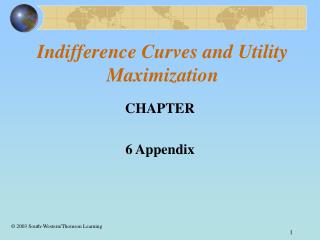
OH* = tariff ridden OC which raises price of imports. Thus, demand shifts away from imports from OA to OB Imports of food (F) H* H M A Q O Exports of cloth (C)
OH* = tariff ridden OC which raises price of imports. Thus, demand shifts away from imports from OA to OB Imports of food (F) H* H M A Q Q shifts to Q*, represents smaller size of trade- contraction of trade B Q* O Exports of cloth (C)
OH* = tariff ridden OC which raises price of imports. Thus, demand shifts away from imports from OA to OB Imports of food (F) H* H M A Q Q shifts to Q*, represents smaller size of trade- contraction of trade B Q* O Exports of cloth (C) d c
Imports of food (F) H* H M A Q B Q* Size of tariff O Exports of cloth (C)
Large country • Assume 2 countries • OCH (large home country) & OCF (small foreign country) • Large country imposing tariff can move TOT in it’s favour • TOT determined by intersection of 2 OCs • Free trade equilibrium at point Q • OQ represents relative prices of exports & imports
Large country: tariff Imports of food (F) OC H O Exports of cloth (C)
Large country: tariff Imports of food (F) OC H OC F Q O Exports of cloth (C)
Large country: tariff Imports of food (F) OC H Line OQ= terms of trade OC F Q O Exports of cloth (C)
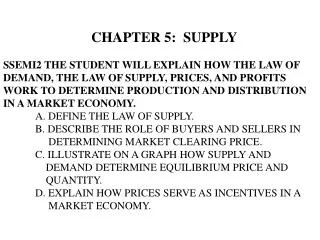
OCH t = tariff ridden offer curve. Large country improves TOT (line OQt steeper than OQ) Imports of food (F) OC H OCH t OC F Qt Q O Exports of cloth (C)
Size of tariff: determination of optimal tariff • If very high tariff; possible trade drastically reduced. Thus, country can not improve it’s welfare • Introduce trade indifference curves (TIC)
Country is not better off after tariff, domestic consumption still at Qt is still on TIC Imports (F) OC H OCH t OC F Q Qt O Exports (C)
Country is not better off after tariff, domestic consumptionat Qt is; still on TIC Imports (F) OC H OCH t OC F Q TIC Qt O Exports (C)
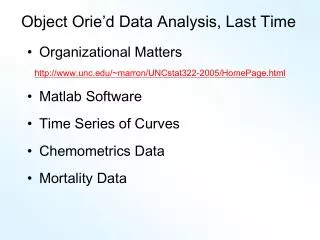
Optimal tariff lies between Q & Qt, represented by OCH t1. Intersects OCF at Qt2 & TIC2 is tangent to foreign country offer curve (OCF) at point Qt2 Imports (F) OC H OCH t1 OCH t Qt2 OC F Q TIC Qt This optimal tariff improves welfare and TOT O Exports (C)
Optimal tariff lies between Q & Qt, represented by OCH t1. Intersects OCF at Qt2 & TIC2 is tangent to foreign country offer curve (OCF) at point Qt2 Imports (F) OC H OCH t2 OCH t Qt2 OC F TIC1 Q Qt TIC This optimal tariff improves welfare and TOT O Exports (C)
Optimal tariff formula • T =__1____ e-1 • (2) lower vol imports (loss) • Where; e = RoW PED for imports • 2 forces at work • (1) TOT (benefit) • Optimum tariff where gain from (1) > loss from (2) by greatest margin; (where TIC1 tangent to OCF) • SEE HANDOUT in lecture for more information
Conclusion • Large countries (or the EU) can move the ToT in its favour • This shouldn’t be the sole reason for forming a CU