Download

1 / 26
260 likes | 441 Views
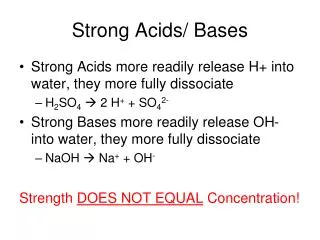
Strong Acids/ Bases. Strong Acids more readily release H+ into water, they more fully dissociate H 2 SO 4 2 H + + SO 4 2- Strong Bases more readily release OH- into water, they more fully dissociate NaOH Na + + OH - Strength DOES NOT EQUAL Concentration!. Acid-base Dissociation.

E N D
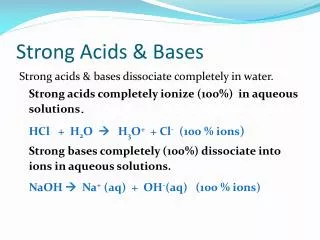
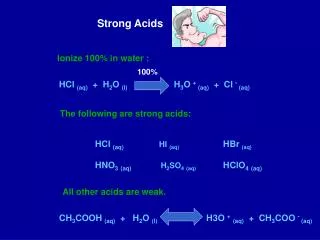
Strong Acids/ Bases • Strong Acids more readily release H+ into water, they more fully dissociate • H2SO4 2 H+ + SO42- • Strong Bases more readily release OH- into water, they more fully dissociate • NaOH Na+ + OH- Strength DOES NOT EQUAL Concentration!
Acid-base Dissociation • For any acid, describe it’s reaction in water: • HxA + H2O x H+ + A- + H2O • Describe this as an equilibrium expression, K (often denotes KA or KB for acids or bases…) • Strength of an acid or base is then related to the dissociation constant Big K, strong acid/base! • pK = -log K as before, lower pK=stronger acid/base!
pKx? • Why were there more than one pK for those acids and bases?? • H3PO4 H+ + H2PO4- pK1 • H2PO4- H+ + HPO42- pK2 • HPO41- H+ + PO43- pK3
Geochemical Relevance? • LOTS of reactions are acid-base rxns in the environment!! • HUGE effect on solubility due to this, most other processes
Dissociation of H2O • H2O H+ + OH- • Keq = [H+][OH-] • log Keq = -14 = log Kw • pH = - log [H+] • pOH = - log [OH-] • pK = pOH + pH = 14 • If pH =3, pOH = 11 [H+]=10-3, [OH-]=10-11 Definition of pH
pH • Commonly represented as a range between 0 and 14, and most natural waters are between pH 4 and 9 • Remember that pH = - log [H+] • Can pH be negative? • Of course! pH -3 [H+]=103 = 1000 molal? • But what’s gH+?? Turns out to be quite small 0.002 or so…
BUFFERING • When the pH is held ‘steady’ because of the presence of a conjugate acid/base pair, the system is said to be buffered • In the environment, we must think about more than just one conjugate acid/base pairings in solution • Many different acid/base pairs in solution, minerals, gases, can act as buffers…
Henderson-Hasselbach Equation: • When acid or base added to buffered system with a pH near pK (remember that when pH=pK HA and A- are equal), the pH will not change much • When the pH is further from the pK, additions of acid or base will change the pH a lot
Buffering example • Let’s convince ourselves of what buffering can do… • Take a base-generating reaction: • Albite + 2 H2O = 4 OH- + Na+ + Al3+ + 3 SiO2(aq) • What happens to the pH of a solution containing 100 mM HCO3- which starts at pH 5?? • pK1 for H2CO3 = 6.35
Think of albite dissolution as titrating OH- into solution – dissolve 0.05 mol albite = 0.2 mol OH- • 0.2 mol OH- pOH = 0.7, pH = 13.3 ?? • What about the buffer?? • Write the pH changes via the Henderson-Hasselbach equation • 0.1 mol H2CO3(aq), as the pH increases, some of this starts turning into HCO3- • After 12.5 mmoles albite react (50 mmoles OH-): • pH=6.35+log (HCO3-/H2CO3) = 6.35+log(50/50) • After 20 mmoles albite react (80 mmoles OH-): • pH=6.35+log(80/20) = 6.35 + 0.6 = 6.95
Bjerrum Plots • 2 D plots of species activity (y axis) and pH (x axis) • Useful to look at how conjugate acid-base pairs for many different species behave as pH changes • At pH=pK the activity of the conjugate acid and base are equal
Bjerrum plot showing the activities of reduced sulfur species as a function of pH for a value of total reduced sulfur of 10-3 mol L-1.
Bjerrum plot showing the activities of inorganic carbon species as a function of pH for a value of total inorganic carbon of 10-3 mol L-1. In most natural waters, bicarbonate is the dominant carbonate species!
THE RELATIONSHIP BETWEEN H2CO3* AND HCO3- We can rearrange the expression for K1 to obtain: This equation shows that, when pH = pK1, the activities of carbonic acid and bicarbonate are equal. We can also rearrange the expression for K2 to obtain: This equation shows that, when pH = pK2, the activities of bicarbonate and carbonate ion are equal.
Bjerrum plot showing the activities of inorganic carbon species as a function of pH for a value of total inorganic carbon of 10-3 mol L-1. In most natural waters, bicarbonate is the dominant carbonate species!
THE CO2-H2O SYSTEM - I Carbonic acid is a weak acid of great importance in natural waters. The first step in its formation is the dissolution of CO2(g) in water according to: CO2(g) CO2(aq) At equilibrium we have: Once in solution, CO2(aq) reacts with water to form carbonic acid: CO2(aq) + H2O(l) H2CO30
THE CO2-H2O SYSTEM - II In practice, CO2(aq) and H2CO30 are combined and this combination is denoted as H2CO3*. It’s formation is dictated by the reaction: CO2(g) + H2O(l) H2CO3* For which the equilibrium constant at 25°C is: Most of the dissolved CO2 is actually present as CO2(aq); only a small amount is actually present as true carbonic acid H2CO30.
THE CO2-H2O SYSTEM - III Carbonic acid (H2CO3*) is a weak acid that dissociates according to: H2CO3* HCO3- + H+ For which the dissociation constant at 25°C and 1 bar is: Bicarbonate then dissociates according to: HCO3- CO32- + H+
Bjerrum plot showing the activities of inorganic carbon species as a function of pH for a value of total inorganic carbon of 10-3 mol L-1. In most natural waters, bicarbonate is the dominant carbonate species!
SPECIATION IN OPEN CO2-H2O SYSTEMS - I • In an open system, the system is in contact with its surroundings and components such as CO2 can migrate in and out of the system. Therefore, the total carbonate concentration will not be constant. • Let us consider a natural water open to the atmosphere, for which pCO2 = 10-3.5 atm. We can calculate the concentration of H2CO3* directly from KCO2: Note that MH2CO3* is independent of pH!
SPECIATION IN OPEN CO2-H2O SYSTEMS - II • The concentration of HCO3- as a function of pH is next calculated from K1: but we have already calculated MH2CO3*: so
SPECIATION IN OPEN CO2-H2O SYSTEMS - III • The concentration of CO32- as a function of pH is next calculated from K2: but we have already calculated MHCO3- so: and
SPECIATION IN OPEN CO2-H2O SYSTEMS - IV • The total concentration of carbonate CT is obtained by summing:
Plot of log concentrations of inorganic carbon species H+ and OH-, for open-system conditions with a fixed pCO2 = 10-3.5 atm.
Plot of log concentrations of inorganic carbon species H+ and OH-, for open-system conditions with a fixed pCO2 = 10-2.0 atm.
Calcite Solubility? • CaCO3 -> Ca2+ + CO32- • Log K=8.48 • Ca2+ in Ocean = 0.0106 m