Download
1 / 45
450 likes | 654 Views
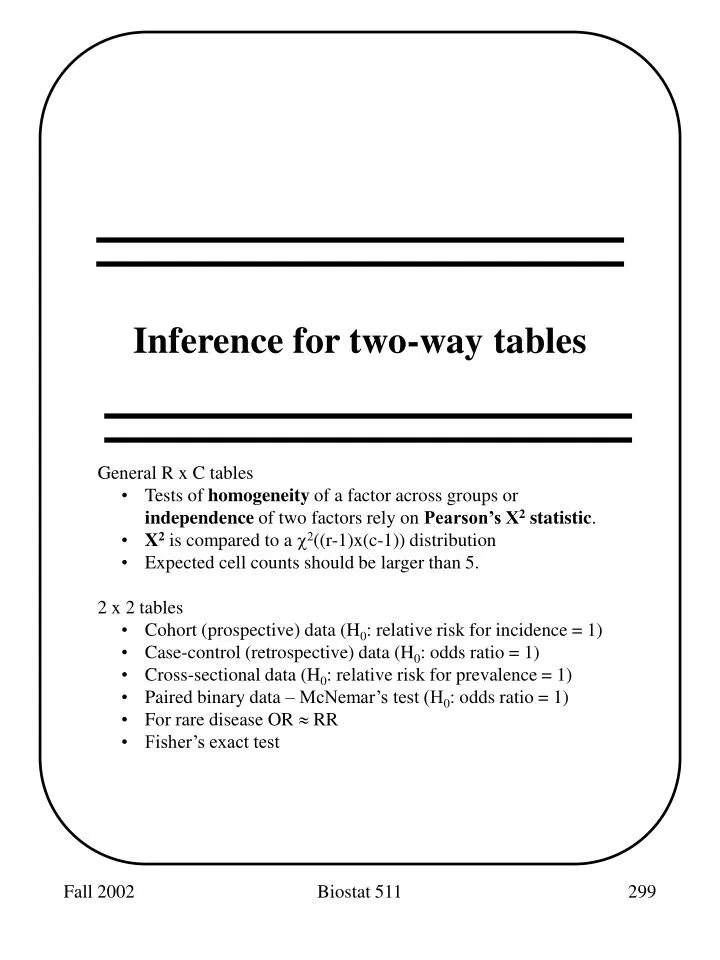
Inference for two-way tables. General R x C tables Tests of homogeneity of a factor across groups or independence of two factors rely on Pearson’s X 2 statistic . X 2 is compared to a c 2 ((r-1)x(c-1)) distribution Expected cell counts should be larger than 5. 2 x 2 tables

E N D
Inference for two-way tables • General R x C tables • Tests of homogeneity of a factor across groups or independence of two factors rely on Pearson’s X2 statistic. • X2is compared to a c2((r-1)x(c-1)) distribution • Expected cell counts should be larger than 5. • 2 x 2 tables • Cohort (prospective) data (H0: relative risk for incidence = 1) • Case-control (retrospective) data (H0: odds ratio = 1) • Cross-sectional data (H0: relative risk for prevalence = 1) • Paired binary data – McNemar’s test (H0: odds ratio = 1) • For rare disease OR RR • Fisher’s exact test Biostat 511
Categorical Data • Types of Categorical Data • Nominal • Ordinal • Often we wish to assess whether two factors are related. To do so we construct an R x C table that cross-classifies the observations according to the two factors. Such a table is called a contingency table. • We can test whether the factors are “related” using a c2 test. • We will consider the special case of 2 x 2 tables in detail. Biostat 511
Categorical Data Contingency tables arise from two different, but related, situations: • We sample members of 2 (or more) groups (e.g. lung cancer vs control) and classify each member according to some qualitative characteristic (e.g. cigarette smoking). • The hypothesis is • H0: groups are homogeneous (p1j=p2j for all j) • HA: groups are not homogeneous Biostat 511
Categorical Data Contingency tables arise from two different, but related, situations: • We sample members of a population and cross-classify each member according to two qualitative characteristics (e.g. willingness to participate in vaccine study vs education level). • The hypothesis is • H0: factors are independent (pij=pi.p.j ) • HA: factors are not independent Biostat 511
Categorical Data Example 1. Education versus willingness to participate in a study of a vaccine to prevent HIV infection if the study was to start tomorrow. Counts, row percents and row totals are given. Biostat 511
Categorical Data Example 2. From the 1984 General Social Survey Biostat 511
Categorical Data Example 3: From Doll and Hill (1952) - retrospective assessment of smoking frequency. The table displays the daily average number of cigarettes for lung cancer patients and control patients. Biostat 511
Test of Homogeneity In example 3 we want to test whether the smoking frequency is the same for each of the populations sampled. We want to test whether the groups are homogeneous with respect to a characteristic. The concept is similar to a t-test, but the response is categorical. H0: smoking frequency same in both groups HA: smoking frequency not the same Q: What does H0 predict we would observe if all we knew were the marginal totals? Biostat 511
Test of Homogeneity A: H0 predicts the following expectations: Each group has the same proportion in each cell as the overall marginal proportion. The “equal” expected number for each group is the result of the equal sample size in each group (what would change if there were half as many cases as controls?) Biostat 511
Test of Homogeneity Recall, we often use the Poisson distribution to model counts. Suppose the observed counts in each cell, Oij, are Poisson random variables with means mij. Then would be approximately normal. It turns out that Z2 has a known distribution … it follows a “chi-squared (2) distribution with 1 degree of freedom” (MM table F). Further, the sum of squared independent standard normal random variables follows a chi-square distribution with n degrees of freedom. Let Zi be standard normals, N(0,1) and let X has a c2(n) distribution Biostat 511
Test of Homogeneity Therefore, We don’t know the mij, but, under H0, we can estimate them based on the margins. We call these the expected counts, Eij. Summing the differences between the observed and expected counts provides an overall assessment of H0. X2 is known as the Pearson’s Chi-square Statistic. Biostat 511
Test of Homogeneity In example 3 the contributions to the X2 statistic are: Looking in MM table F, we find that = 11.07. Conclusion? Biostat 511
Test of Independence • The Chi-squared Test of Independence is mechanically the same as the test for homogeneity. The only difference is that the R x C table is formed based on the levels of 2 factors that are cross-classified. Therefore, the null and alternative hypotheses are different: • H0: The two factors are independent • HA: The two factors are not independent • Independence implies that each row has the same relative frequencies (or each column has the same relative frequency). • Example 1 is a situation where individuals are classified according to two factors. In this example, the assumption of independence implies that willingness to participate doesn’t depend on the level of education. Biostat 511
Q: Based on the observed row proportions, how does the independence hypothesis look? Q: How would the expected cell frequencies be calculated? Q: How many degrees of freedom would the chi-square have? Biostat 511
The expected counts under independence are ... X2 = 89.7 15 df p < .0001 Biostat 511
Summary c2Tests for R x C Tables 1. Tests of homogeneity of a factor across groups or independence of two factors rely on Pearson’s X2 statistic. 2. X2is compared to a c2((r-1)x(c-1)) distribution (MM, table F or display chiprob(df,X2)). 3. Expected cell counts should be larger than 5. 4. We have considered a global test without using possible factor ordering. Ordered factors permit a test for trend (see Agresti, 1990). Biostat 511
2 x 2 Tables Example 1: Pauling (1971) Patients are randomized to either receive Vitamin C or placebo. Patients are followed-up to ascertain the development of a cold. Q: Is treatment with Vitamin C associated with a reduced probability of getting a cold? Q: If Vitamin C is associated with reducing colds, then what is the magnitude of the effect? Biostat 511
2 x 2 Tables Example 2: Keller (AJPH, 1965) Patients with (cases) and without (controls) oral cancer were surveyed regarding their smoking frequency (this table collapses over the smoking frequency categories). Q: Is oral cancer associated with smoking? Q: If smoking is associated with oral cancer, then what is the magnitude of the risk? Biostat 511
2 x 2 Tables Example 3: Norusis (1988) In 1984, a random sample of US adults were cross-classified based on their income and reported job satisfaction: Q: Is salary associated with job satisfaction? Q: If salary is associated with satisfaction, then what is the magnitude of the effect? Biostat 511
2 x 2 Tables Example 4: HIVNET (1995) Subjects were surveyed regarding their knowledge of vaccine trial concepts both at baseline and at month 3 after an informed consent process. The following table shows the subjects cross-classified according to the two responses. Q: Did the informed consent process improve knowledge? Q: If informed consent improved knowledge then what is the magnitude of the effect? Biostat 511
2 x 2 Tables Each of these tables can be represented as follows: The question of association can be addressed with Pearson’s X2 (except for example 4) We compute the expected cell counts as follows: Expected: Biostat 511
2 x 2 Tables Pearson’s chi-square is given by: Q: How does this X2 test compare in Example 1 to simply using the 2 sample binomial test of Biostat 511
2 x 2 Tables Example 1: Pauling (1971) H0 : probability of disease does not depend on treatment HA : probability of disease does depend on treatment For the p-value we compute P(2(1) > 4.81) = 0.028. Therefore, we reject the independence of treatment and disease. Biostat 511
Two sample test of binomial proportions: p1 = P(cold | Vitamin C) p2 = P(cold | placebo) H0 : p1 = p2 HA : p1 p2 For the 2-sided p-value we compute 2 P(| Z | > 2.193) = 0.028. Therefore, we reject H0 with the exact same result as the 2test. (Z2 = X2) Biostat 511
2 x 2 Tables Applications In Epidemiology Example 1 fixed the number of E and not E, then evaluated the disease status after a fixed period of time. This is a prospective study. Given this design we can estimate the relative risk: The range of RR is [0, ). By taking the logarithm, we have (- , +) as the range for ln(RR) and a better approximation to normality for the estimated ln Biostat 511
The estimated relative risk is: We can obtain a confidence interval for the relative risk by first obtaining a confidence interval for the log-RR: For Example 1, a 95% confidence interval for the log relative risk is given by: Biostat 511
-0.593 ± 1.96 × 0.277 -0.593 ± 0.543 (-1.116, -0.050) To obtain a 95% confidence interval for the relative risk we exponentiate the end-points of the interval for the log - relative risk. Therefore, ( exp(-1.116), exp(-0.050)) ( .33 , .95 ) is a 95% confidence interval for the relative risk. Biostat 511
2 x 2 Tables Applications In Epidemiology In Example 2 we fixed the number of cases and controls then ascertained exposure status. Such a design is known as case- control study. Based on this we are able to directly estimate: However, we generally are interested in the relative risk which is not estimable from these data alone - we’ve fixed the number of diseased and diseased free subjects. Instead of the relative risk we can estimate the exposure odds ratio which Cornfield (1951) showed equivalent to the disease odds ratio: Biostat 511
Odds Ratio Furthermore, for rare diseases, P(D | E) 0 so that the disease odds ratio approximates the relative risk: Since with case-control data we are able to effectively estimate the exposure odds ratio we are then able to equivalently estimate the disease odds ratio which for rare diseases approximates the relative risk. Biostat 511
2 x 2 Tables Applications in Epidemiology Like the relative risk, the odds ratio has [0, ) as its range. The log odds ratio has (- , +) as its range and the normal approximation is better as an approximation to the estimated log odds ratio. Confidence intervals are based upon: Therefore, a (1 - ) confidence interval for the log odds ratio is given by: Biostat 511
Example 2: The estimated odds ratio (odds of cancer for smokers relative to the odds of cancer for non-smokers) is given by: A 95% confidence interval for the log odds ratio is given by: Biostat 511
To obtain a 95% confidence interval for the odds ratio we simply exponentiate the end-points of the interval for the log odds ratio. Therefore, ( exp(0.983) , exp(1.883) ) or ( 2.672 , 6.573 ) is a 95% confidence interval for the odds ratio. Biostat 511
2 x 2 Tables Applications in Epidemiology Example 3 is an example of a cross-sectional study since only the total for the table is fixed in advance. The row totals or column totals are not fixed in advance. In epidemiological studies, the relative risk or odds ratio may be used to summarize the association when using a X-sectional design. The major distinction from a prospective study is that a cross-sectional study will reveal the number of cases currently in the sample. These are known as prevalent cases. In a prospective study we count the number of new cases, or incident cases. Biostat 511
Paired Binary Data Example 4 measured a binary response pre and post treatment. This is an example of paired binary data. One way to display these data is the following: Q: Can’t we simply use X2 Test of Homogeneity to assess whether this is evidence for an increase in knowledge? A: NO!!! The X2 tests assume that the rows are independent samples. In this design it is the same 595 people at Baseline and at 3 months. Biostat 511
Paired Binary Data For paired binary data we display the results as follows: This analysis explicitly recognizes the heterogeneity of subjects. Thus, those that score (0,0) and (1,1) provide no information about the effectiveness of the treatment since they may be “weak” or “strong” individuals. These are known as the concordant pairs. The information regarding treatment is in the discordant pairs, (0,1) and (1,0). p1 = success probability at Time 1 p2 = success probability at Time 2 H0 : p1 = p2 HA : p1 p2 Biostat 511
Paired Binary Data McNemar’s Test Under the null hypothesis, H0 : p1 = p2, we expect equal numbers to change from 0 to 1 and from 1 to 0 (E[n01] = E[n10]). Specifically, under the null: Under H0, Z2 ~ 2(1), and forms the basis for McNemar’s Test for Paired Binary Responses. The odds ratio comparing the odds of success at Time 2 to Time 1 is estimated by: Confidence intervals can be obtained as described in Breslow and Day (1981), section 5.2, or in Armitage and Berry (1987), chapter 16. Biostat 511
Paired Binary Data A common epidemiological design is to match cases and controls regarding certain factors (e.g. age, gender…) then ascertain the exposure history (e.g. smoking) for each member of the pair. The results for all pairs can be summarized by: Given this design we can use McNemar’s Test to test the hypotheses H0 : (OR = 1) HA : (OR 1) Biostat 511
Example 4: We can test H0: p1 = p2 using McNemar’s Test: Comparing 7.012 to a 2 (1) we find that p < 0.001. Therefore we reject the null hypothesis of equal success probabilities for Time 1 and Time 2. We estimate the odds ratio as Biostat 511
Summary for 2 x 2 Tables • Cohort Analysis (Prospective) • 1. H0: • 2. RR for incident disease • 3. 2 test • Case Control Analysis (Retrospective) • 1. H0: • 2. OR ( RR for rare disease) • 3. 2 test • Cross-sectional Analysis • 1. H0: • 2. RR for prevalent disease • 3. 2 test • Paired Binary Data • 1. H0: • 2. OR • 3. McNemar’s test Biostat 511
Fisher’s Exact Test Motivation: When a 2 2 table contains cells that have fewer than 5 expected observations, the normal approximation to the distribution of the log odds ratio (or other summary statistics) is known to be poor. This can lead to incorrect inference since the p-values based on this approximation are not valid. Solution: Use Fisher’s Exact Test Biostat 511
Fisher’s Exact Test Example: (Rosner, p. 370) Cardiovascular disease. A retrospective study is done among men aged 50-54 who died over a 1-month period. The investigators tried to include equal numbers of men who died from CVD and those that did not. Then, asking a close relative, the dietary habits were ascertained. A calculation of the odds ratio yields: Interpret. Biostat 511
Fisher’s Exact Test If we fix all of the margins then any one cell of the table will allow the remaining cells to be filled. Note that a must be greater than 0, less than both n1 and m1, and an integer. Thus there are only a relatively few number of possible table configurations if either n1or m1 is small (with n1, n2, m1, m2 fixed). Under the null hypothesis, H0 : OR = 1 we can use the hypergeometric distribution (a probability distribution for discrete rv’s) to compute the probability of any given configuration. Since we have the distribution of a statistic (a) under the null, we can use this to compute p-values. Biostat 511
Fisher’s Exact Test Example: (Rosner, p. 370) Cardiovascular disease. Possible Tables: .017 .105 .252 .312 .001 .016 .082 .214 Biostat 511
Fisher’s Exact Test • Using the hypergeometric distribution we can compute the exact probability of each of these tables (under H0: p1 = p2) (Rosner pg. 370) • To compute a p-value we then use the usual approach of summing the probability of all events (tables) as extreme or more extreme than the observed data. • For a one tailed test of p1 < p2 (p1 > p2) we sum the probabilities of all tables with a less than or equal to (greater than or equal to) the observed a. • For a two-tailed test of p1 = p2 we compute the two one-tailed p-values and double the smaller of the two. • You will never do this by hand …. Biostat 511
Categorical data -summary 2 x 2 ? Yes No Samples independent? 2 x k ? Yes No Yes No McNemar’s test Test for trend in proportions? 2 test for R x C table Expected > 5? Yes No Yes No 2 sample Z test for proportions or 2 test 2 test for trend Fisher’s exact test Expected > 5? No Yes Exact test 2 test Biostat 511