Download
1 / 12
130 likes | 316 Views
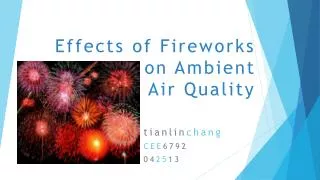
Effects of Fireworks on Ambient Air Quality. tianlin chang CEE 6792 04 25 13. Health Effects. PM 10 & PM 2.5 (Metals, acids, etc.) Neurological, hematological, carcinogenic effects Respiratory problems SO 2 & NO 2 Cardiovascular diseases

E N D
Effects of Fireworkson Ambient Air Quality tianlinchang CEE6792 042513
Health Effects • PM10 & PM2.5 (Metals, acids, etc.) • Neurological, hematological, carcinogenic effects • Respiratory problems • SO2 & NO2 • Cardiovascular diseases • Developmental problems (premature births, etc.) • O3 • Respiratory problems (asthma, bronchitis, etc.)
Cultural Background Delhi & Lucknow, India Atlanta, GA New Year’s Independence Day/July 4th • Diwali Festival • Hindu “Festival of Lights” • Household-to-household
Case Study: Delhi, India • Population: 21 million • PM10, SO2, NO2 • 24 hr. samplingat 13 m • Representative of 2/3 stories APM-411 gaseous sampler & respirabledust sampler
Delhi Results NO2 Trends PM10 Trends • One vs. multiple sites • Exact site location? • Urban vs. suburban • Avg. typical day? SO2 Trends
Case Study: Lucknow, India • Population: 4.8 million • PM10, SO2, NO2, 10 trace metals • 24 hr. sampling at 4 residential sites • North, East, South, West Envirotechrespirabledust sampler
Lucknow Results NO2 Trends PM10 Trends • Sampling height? • Post-Diwali data? • Multiple years SO2 Trends
Limitations to the Atlanta Data • AQS Site specifics unknown • Dekalb County- not representative of downtown Atlanta • Sampling height? • Inconsistent AQS sites • No detailed information as to how EPA data was collected • Non-standardized testing methods • Missing data (days-months/year)
Conclusion • Possible explanations • Diwali- celebration of MUCH larger magnitude on household scale (1.2 billion vs. 300 million) • Developing country with less regulations- emissions of higher range/scale • Off days + public gatherings downtown ATL- decreased cars and less emissions in suburbs than typical day • Atlanta measurements at ground-level or higher? • From case studies: • PM10, SO2, NO2- clear increase • Co, Ni, Cd, Cr- statistically significant changes • Atlanta data • Skewed data points • PM10- unclear • PM2.5- slight increase • NO2- clear decrease • SO2- decrease • O3- unclear