Download
1 / 39
390 likes | 486 Views
Explore post-2007 food and financial crises impact on agricultural development policies, global economic synchronization, and food price crisis analysis. Investigate historical data and commodity price indexes.

E N D
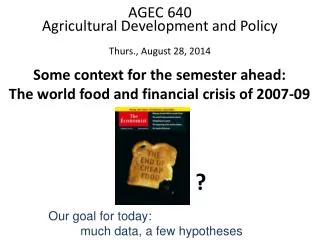
AGEC 640Agricultural Development and PolicyThurs., August 28, 2014 Some context for the semester ahead:The world food and financial crisis of 2007-09 ? Our goal for today: much data, a few hypotheses
The 2007-09 crises, in one picture • DBA index = four major crops, in US dollars • USD index = six major currencies, per US dollar • S&P500 index = all major companies, in US dollars commodities rise as stocks fall all rise all fall, then move together Our goal for today: much data, a few hypotheses Source: Computed from data at www.google.com/finance. Note: The DBA index is corn, wheat, soy and sugar (25% each). The USD DNX index is the currencies of Europe (57.6%), Japan (13.6%), Britain (11.9%), Canada (9.1%), Sweden (4.2) and Switzerland (3.6%), per US dollar. The S&P 500 is a value-weighted sum of large U.S. companies.
Let’s start with the economy as a whole GDP growth in the United States (pct./year, quarterly data) Things have improved! Reprinted from IMF (2009), Country Report: United States (July). http://www.imf.org/external/pubs/ft/scr/2009/cr09229.pdf
The global economy is now relatively synchronized Who is doing best? Source: http://www.imf.org/external/pubs/ft/weo/2010/update/02/index.htm
Reprinted from IMF(2009), World Economic Outlook Update (July, www.imf.org).
In the U.S.,consumption and employmentDRIVE policy choices,especially interest rates… Reprinted from SIFMA (2009), Economic Outlook (June). http://www.sifma.org/research/pdf/EconOutlook0609.pdf
A new aspect of the recent/current crisis was the collapse of mortgage-backed securities in the U.S. Residential Commercial Reprinted from SIFMA (2009), Research Quarterly (August) http://www.sifma.org/research/pdf/RRVol4-8.pdf
…and the collapse of a large “shadow banking” sector on other assets Reprinted from SIFMA (2009), Research Quarterly (August) http://www.sifma.org/research/pdf/RRVol4-8.pdf
…which made all financial transactions unusually risky Perceived bankruptcy risk for banks Perceived bankruptcy risk for U.S. companies Source: Federal Reserve Bank of St. Louis, 2009. (http://research.stlouisfed.org/publications/es/09/ES0924.pdf)
…and remember we are all connected Source: NY Times “Europe’s Web of Debt” (May 1, 2010)
Looking within the food price crisis Rice rose first and spiked highest Other crops rose/fell in sync Note typical spike-and-valley pattern Hold that thought…we’ll return to it later in the semester Reprinted from P.C. Abbott (2009), Development Dimensions of High Food Prices. Paris: OECD.
A pre-history of the current crisis Index of real international food prices, 1900 to 2005 (1977-79 =100) Not yet any sign of the 2007-08 price rise Source: K. Anderson (2006), “Reducing Distortions to Agricultural Incentives: Progress, Pitfalls and Prospects.” <www.worldbank.org/agdistortions>. Data shown are an index of export prices in US dollars for all major traded agricultural products, deflated by the MUV index which is the unit value of manufactures exported from France, Germany, Japan, UK and US, with weights based on those countries’ exports to developing countries.
A pre-history of the current crisis Index of real international food prices, 1900 to 2005 (1977-79 =100) The spike-and-valley pattern creates cycles of panic and then complacency The 1973 crisis led to investments that brought prices down to unusually low and stable levels Source: K. Anderson (2006), “Reducing Distortions to Agricultural Incentives: Progress, Pitfalls and Prospects.” <www.worldbank.org/agdistortions>. Data shown are an index of export prices in US dollars for all major traded agricultural products, deflated by the MUV index which is the unit value of manufactures exported from France, Germany, Japan, UK and US, with weights based on those countries’ exports to developing countries.
The spike-and-valley cyclesdiffer somewhat among crops IMF indexes of nominal commodity prices, January 1992=100 Source: Reproduced from Ronald Trostle, “Global Agricultural Supply and Demand: Factors Contributing to the Recent Increase in Food Commodity Prices”, Outlook Report WRS-0801. Washington, DC: ERS/USDA, July 2008.
Other commodities fluctuateeven more than food Note how urea spiked the most Reprinted from P.C. Abbott (2009), Development Dimensions of High Food Prices. Paris: OECD.
So far in the 2009-12 recovery, food prices have not risen as much as oil & metals Index values (Jan.2009=100) Reprinted from IMF(2009), World Economic Outlook Update (July, www.imf.org).
Relative to other things, food has remained cheap by historical standards… Index values (2007=100) Source: Reproduced from IMF, “Food and Fuel Prices—Recent Developments, Macro-economic Impact, and Policy Responses.” Washington, DC: IMF, June 30, 2008 (58 pages).
But food prices have rebounded in the past few years, to levels that echo the 1970s… Source: Reproduced from FAO “World Food Situation” Rome: FAO (accessed 08/26/2014).http://www.fao.org/worldfoodsituation/wfs-home/foodpricesindex/en/
and food is still barely affordable for the poorest Index values (2007=100) At the all-time low prices of 2002… And when prices rise… March 13, 2002 World: Many Hungry Mouths Around 815 million people -- 13 percent of the world's population -- suffer from hunger and malnutrition, mostly in developing countries, said Jacques Diouf, head of the United Nations Food and Agriculture Organization. Source: Reproduced from IMF, “Food and Fuel Prices—Recent Developments, Macro-economic Impact, and Policy Responses.” Washington, DC: IMF, June 30, 2008 (58 pages).
Local crises are driven by underlying world market conditions and local “stochastic” events
Looking globally, note that prices in other currencies have risen much less than in dollars Corn price movements in nominal U.S. dollars, real euros and other currencies Source: Reproduced from Philip C. Abbott, Christopher Hurt and Wallace E. Tyner, “What’s Driving Food Prices?” Oak Brook, IL: Farm Foundation, July 2008 (82 pages).
Local prices don’t always link directly to “world market” prices Source: Reprinted from IFPRI (2008), “An Assessment of the Likely Impact on Ugandan Households of Rising Global Food Prices.” Kampala, Uganda: IFPRI, June 9th 2008 (39 pages).
Why did food prices spike?The USDA’s summary of conventional wisdom Source: Reproduced from Ronald Trostle, “Global Agricultural Supply and Demand: Factors Contributing to the Recent Increase in Food Commodity Prices”, Outlook Report WRS-0801. Washington, DC: ERS/USDA, July 2008.
The stage was set by low world stocks IMF price indexes Total world grain & oilseeds stocks Source: Reproduced from Trostle (2008), from IMF data on prices and USDA estimates on stocks.
On the demand side, food consumptionis driven by population and income… Reprinted from The Economist, 8 December 2007.
…and recently by biofuels policy as well Ethanol (mostly US) Biodiesel (mostly EU) Source: Reproduced from Trostle (2008), from USDA data and projections.
Biofuels feedstocks vary, but all use land Source: Reproduced from Trostle (2008), from various estimates.
The U.S. use of corn for ethanol has been especially fast-growing Source: Reproduced from Trostle (2008), from USDA data and projections.
U.S. increased corn use for ethanol accounts for 30% of world increase in all uses of all grains …about the same share as increased feed use; food use accounts for 44% of growth Source: Reproduced from Trostle (2008), from USDA data and projections.
…but on a per-capita basis, Africa imports even more than Asia
The price rise was due partly to slowdown in per-capita production growth…
But not all farmers are net sellers! Table 1.
The poor sell little, or are net buyers Farm household net crop sales in Tanzania, by income level Net buyers Net buyers Net buyers Note: All data are from the Kagera Health and Development Survey (www.worldbank.org/lsms); results shown are a local polynomial regression with its 95% confidence interval, for surveyed households with agricultural production (579 in 1991-92, and 557 in 1992-93). Staple food crops are maize, cassava, cooking bananas, millet, sorghum, and yams or potatoes. The household’s expenditure per capita is measured in 2006 U.S. dollars converted at PPP prices. Source: Reprinted from A. Rios, W.A. Masters and G.E. Shively (2008), “Agricultural Prices and Income Distribution among Farmers .” Working Paper available online at www.agecon.purdue.edu/staff/shively/RMS.pdf.
Whew! Conclusions? • There’s a lot of data out there • not everything is measured, but much is known • relationships between variables remain questionable • Hw #1 will give you experience using those data • write-ups should describe what you see in the data; inferring causality is risky (avoid saying “because”); it is far more honest to speak of “association” • Next week, we begin systematic search for links between economic growth, agricultural development and government policies…