PERT Charts
PERT Charts. Prepared by: Michael Palazzo. What are PERT Charts?. PERT stands for Program Evaluation and Review Technique To understand what a PERT chart is, we must first learn the Critical Path Method (CPM). CPM. Developed as a network model for project management


PERT Charts
E N D
Presentation Transcript
PERT Charts Prepared by: Michael Palazzo
What are PERT Charts? • PERT stands for Program Evaluation and Review Technique • To understand what a PERT chart is, we must first learn the Critical Path Method (CPM)
CPM • Developed as a network model for project management • Uses a fixed time estimate for each activity • Easy to understand but does not account for time variations of activities
What is PERT? • Developed in late 1950’s • A network model that allows for randomness in activity completion times • Has potential to reduce time and cost to complete a project
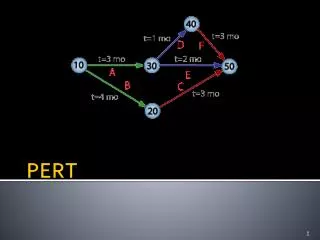
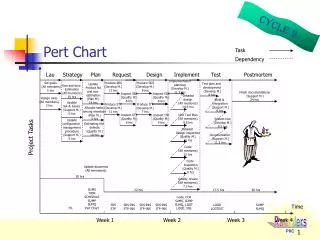
Network Diagrams • PERT Charts use network diagrams • Activities and milestones of a project are represented by arcs and nodes on a model • PERT was originally Activity-on-Arc diagram • Some now use Activity-on-Node
Arc vs. Node Activity-on-node network: Activity-on-arc network:
6 Steps • Identify • Determine Activity Sequence • Construct • Estimate • Determine Critical Path • Update
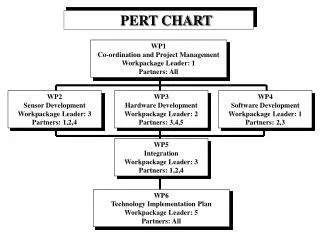
Identify/Determine Activity Sequence • Identify Activities and Milestones: • Activities are tasks • Milestones mark beginning and end of activities • Determine Activity Sequence: • Sequence is evident for some • Others require more analysis
Construct • Construct the Network Diagram: • Create diagram with activity sequence info • For activity-on-arc model, activities are arrowed lines and milestones are circles • Software exists to simplify this step
Estimate • Estimate Activity Times: • Weeks are commonly used as unit of time • PERT is able to deal with uncertainty in activity completion times • Each activity in model includes three time estimates
Estimate Continued… • Optimistic Time: • Shortest time activity can be completed • Most Likely Time: • Completion time with highest probability • Pessimistic Time: • Longest time the activity might require
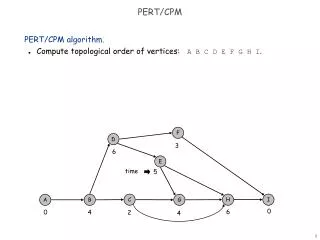
Determine Critical Path • Critical path is longest path in project • Determined by adding the times for activities in each sequence • By accelerating activities on critical path you decrease total project time
Update • Update as Project Progresses: • Make adjustments to PERT chart as project continues • Resources may need to be added to stay on schedule if there are delays
Benefits of PERT • Gives expected project completion time • Provides probability of completionbefore a date • Shows critical path activities
Benefits Continued… • Provides activity start and end dates • Shows activities that have slack time
Limitations of PERT • The activity time estimates are subjective • PERT assumes a beta distribution for its time estimates; actual distribution may be different
Limitations Continued… • Consistently underestimates the expected project completion time • PERT assumes probability distribution of project completion time is same as critical path • If delayed, other paths can become critical path
References • Pert Charts:http://www.netmba.com/operations/project/pert/ • More Information on CPM/CPA:http://www.mindtools.com/critpath.html • PERT Chart Images:http://en.wikipedia.org/wiki/Program_Evaluation_and_Review_Techniquehttp://cpmtutor.com/c05/fp-dummies.htmlhttp://cnx.org/content/m32170/latest/