Download
1 / 31
330 likes | 523 Views
Practical estimating and scheduling ----- Critical Path /“Pert” Charts. Phase 4 - Due Dec 6.

E N D
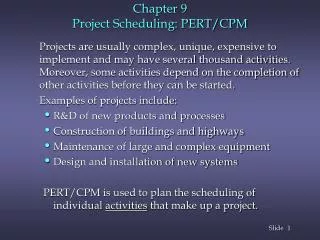
Practical estimating and scheduling-----Critical Path /“Pert” Charts
Phase 4 - Due Dec 6 Use Microsoft Project to Create a Labor-Only Project Plan - Imagine your team to be part of a company with unlimited resources. Imagine your target to be the successful completion of the entire system. Imagine that you are about to plan the labor for the entire job to the finest detail. List all the tasks to be completed. EVERY TRACKABLE TASK MUST BE INCLUDED: • the man-hour estimate for each task • the number of people who can work effectively and simultaneously on the task • the precedent tasks - task(s) that must be completed prior to performing this task • use the subordinate task capability to “roll up” subtasks into meaningful larger tasks.
Do NOT include hardware costs. However, the labor to select and purchase hardware should be included. Using the Critical Path (Pert, or “Network”) Chart, calculate the calendar time of the complete job. Using a rate of $105/hr., calculate the total job cost, prepare to defend your estimates in class. Submit the Project file and a single page summary. On the summary, include total job cost and calendar time. Notes: the Project Plan is your guide for both time and money. Every trackable effort must be included. If there is a particular component to be implemented, it must include Specification, Design, Coding, and Testing tasks. There may be partial and full integration efforts, design reviews, status reports, everything that needs to be paid-for.
get MS Project http://e5.onthehub.com/WebStore/ProductsByMajorVersionList.aspx?ws=41661bdf-c99b-e011-969d-0030487d8897&vsro=8&JSEnabled=1 your username is your UB email if you don't have the password, please write an email to: cse-consult@buffalo.edu and ask for your MSDNAA account password
Readings Reading List #3 on "Features" due by Nov 15 Please read the "Tao of Pooh" by Nov 19
A “Work Breakdown Structure” • Work Breakdown Structure • Every trackable non-free $$$ task • Everything • How many people, how much time
some tasks we forget • meetings • document preparation • status and project management • customer training
typical - done once Customer meetings System Spec Review SRS Review Top Level Design Test Plan Review Integration Documentation Customer Site Deployment
typical - done for each module Detailed Design Code Walk-thru / Review Unit Test
Critical Paths, or "Pert" charts:A Project Management Tool • If you’re not doing Critical Paths, you’re not doing project management. • Shows the time sequence of events, including parallel efforts. • Determines length (calendar time) of a project.
INPUT: • List of Activities • Activity Duration (best estimate) • Sequential Activity Relationships • what precedes a task • what can be done at the same time • what follows a task OUTPUT • Activity and Project Completion Time • Critical Path / Critical Activities / A delay here will delay the entire project • Activity Slack – a single activity not in the critical path has extra time to complete
Pert Chart • tasks a and b can start simultaneously • task c can start after a is complete • task d can start after b is complete • c and d must complete before e can begin A c a e C&D E 0 B b d
How to… The Next Task The Task The Completion of the Task Duration
Draw a Pert Chart for this job: Task Title Duration Precedence • start 0 - • think 1 a • plan 2 b • procrastinate 5 a • assign to someone else 1 c,d • hide 3 e • finish 1 e • grab credit 1 f,g
b a c e f A B C C&D E F F&G H 1 2 1 3 1 0 g d 1 5 G D Critical Path = A D E F H slack in B C, G
A good first-phase estimate can be done in a day. • Estimation is an exercise in disassembly (and is therefore integral with design), and interpersonal skills. • NOT a negotiation (negotiation implies compromise, but there should be no compromise of reality). • Time and cost sacrifices must be offset by features and effort.
Estimates are done and redone at the end of requirements, analysis, and design. • Lines-of-code? • # of people? length of task? • The LOC charts are good, but per-person productivity history for your company is better.
Estimating is not negotiation. • Estimating is not adjusting numbers to the known right answer. • Estimates not to be trusted: those responsible (will be conservative) and those who interface to the customer (will be optimistic). Use those estimates, but reduce the first by 30%, increase the second by 30%. Why 30%? It’s the universal feel-good multiplier.
Danger - there is a temptation to up the LOC/person/day just to lower estimates. • Cultivate an attitude of “stunned disbelief” when asked to adjust an estimate on non-technical factors. Practice in front of a mirror.
The usual estimation path: • Vague description of job • Told by marketing/management what is the absolute maximum that can be spent, or you’re fired • You agree to it and stress out
Avoid gamesmanship - do not pad estimates do not expand work to fill available time do not code-like-crazy from day 1
Cocomo Model • Take the line of code estimate • Adjust it for “Scale”. The 5 Scale Drivers are: Precedentedness Development Flexibility Architecture / Risk Resolution Team Cohesion Process Maturity
Factor in a Cost Driver: COCOMO II has 17 cost drivers – you assess your project, development environment, and team to set each cost driver. The cost drivers are multiplicative factors that determine the effort required to complete your software project. For example, if your project will develop software that controls an airplane's flight, you would set the Required Software Reliability (RELY) cost driver to Very High. That rating corresponds to an effort multiplier of 1.26, meaning that your project will require 26% more effort than a typical software project.
Adjust it for level of effort: The COCOMO II model makes its estimates of required effort (measured in Person-Months – PM) based primarily on your estimate of the software project's size (as measured in thousands of SourceLOC or KSLOC)): Effort = 2.94 * EAF * (KSLOC)E Where: EAF Is the Effort Adjustment Factor derived from the Cost Drivers E Is an exponent derived from the five Scale Drivers
As an example, a project with all Nominal Cost Drivers and Scale Drivers would have an EAF of 1.00 and exponent, E, of 1.0997. Assuming that the project is projected to consist of 8,000 source lines of code, COCOMO II estimates that 28.9 Person-Months of effort is required to complete it: Effort = 2.94 * (1.0) * (8)1.0997 = 28.9 Person-Months
Adjust it again: The Effort Adjustment Factor in the effort equation is simply the product of the effort multipliers corresponding to each of the cost drivers for your project. For example, if your project is rated Very High for Complexity (effort multiplier of 1.34), and Low for Language & Tools Experience (effort multiplier of 1.09), and all of the other cost drivers are rated to be Nominal (effort multiplier of 1.00), the EAF is the product of 1.34 and 1.09. Effort Adjustment Factor = EAF = 1.34 * 1.09 = 1.46 Effort = 2.94 * (1.46) * (8)1.0997 = 42.3 Person-Months
The COCOMO II schedule equation predicts the number of months required to complete your software project. The duration of a project is based on the effort predicted by the effort equation: Duration = 3.67 * (Effort)SE Where: Effort - Is the effort from the COCOMO II effort equation SE - Is the schedule equation exponent derived from the five Scale Drivers
Continuing the example, and substituting the exponent of 0.3179 that is calculated from the scale drivers, yields an estimate of just over a year, and an average staffing of between 3 and 4 people: Duration = 3.67 * (42.3)0.3179 = 12.1 months Average staffing = (42.3 Person-Months) / (12.1 Months) = 3.5 people
um, adjust it again: The COCOMO cost driver for Required Development Schedule (SCED) is unique. The SCED cost driver is used to account for the observation that a project developed on an accelerated schedule will require more effort than a project developed on its optimum schedule. A SCED rating of Very Low corresponds to an Effort Multiplier of 1.43 (in the COCOMO II.2000 model) and means that you intend to finish your project in 75% of the optimum schedule (as determined by a previous COCOMO estimate).
Continuing the example used earlier, but assuming that SCED has a rating of Very Low, COCOMO produces these estimates: Duration = 75% * 12.1 Months = 9.1 Months Effort Adjustment Factor = EAF = 1.34 * 1.09 * 1.43 = 2.09 Effort = 2.94 * (2.09) * (8)1.0997 = 60.4 Person-Months Average staffing = (60.4 Person-Months) / (9.1 Months) = 6.7 people
Notice that the calculation of duration isn't based directly on the effort (number of Person-Months) – instead it's based on the schedule that would have been required for the project assuming it had been developed on the nominal schedule. Remember that the SCED cost driver means "accelerated from the nominal schedule".