Download
1 / 36
360 likes | 378 Views
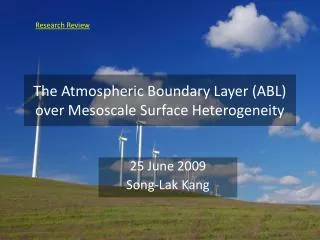
This study presents an observing system for monitoring the atmospheric boundary layer (ABL) at Concordia Station in Antarctica. The system aims to understand the processes occurring in the planetary boundary layer (PBL) and their impact on climate and ice sheets. Various meteorological measurements, turbulence measurements, radiation measurements, temperature and ground flux measurements, and ground-based remote sensing techniques are used to study the behavior of the ABL.

E N D
An observing system for atmospheric boundary layer monitoring at Concordia station, Antarctica S. Argentini ISAC-CNR Via del Fosso del Cavaliere 100, 00133 Roma, Italy Email : s.argentini@isac.cnr.it
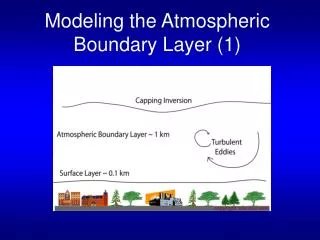
RATIONALE FOR ATMOSPHERIC BOUNDARY LAYER OBSERVATIONS AT DOME C, ANTARCTICA • In recent years the interest in the interaction of the atmosphere with the ice sheets of Antarctica through surface and boundary layer processes is increased. • Cooling of the ice surface during the Antarctic winter drives the katabatic winds that are a major feature of Antarctic climate. • Sublimation and wind-borne transport of snow can make significant • contributions to the local or regional surface mass balance and so can • influence the dynamics of the ice sheets. • An observing system is needed especially over the Antarctic plateau where long time series of measurements are not available. • An observing system for atmospheric ABL parameters was set at Concordia station at Dome C during the first 2005 winter over. An improved set of instrumentation will work during the campaign 2011-2012.
Scientific objectives of STABLEDC (Study of Stable Boundary Layer Environmental at Dome) General objective : Study of the processes occurring in PBL Specific objectives: • Monitoring of atmospheric parameters • Energy and radiation budget • Parameterization of the long - lived stable boundary layer • Summer weak convective boundary layer observations • Behaviour of the temperature inversion during the year • Periodicity, occurrence of the warming events during the winter • Interaction between local and large scale circulation • Contribute to atmospheric site testing for astronomy at Dome C
EXPERIMENTAL SITE Concordia Station The experimental site was located 1000 m south of the base upwind to the prevailing wind direction to avoid disturbances in measurements.
SURFACE LAYER METEOROLOGICAL MEASUREMENTS METEO TOWER measurements • 1.25 m Temperature • 2.5 m, 5 m, 10 m • Temperature - Wind Speed - Relative Humidity • 12 m Net Radiometer • 13 m Wind Direction • Surface Layer Profiles (Wind, Temperature, Humidity) • Surface Layer Fluxes (Heat and Momentum) using GRADIENT METHOD
SURFACE LAYER TURBULENCE MEASUREMENTS • Sonic anemometer measurements • Wind components : u, v, w • Sonic Temperature ( sort of • virtual temperature) 3 m- mast Sonic thermo- anemometer mod. USA - 1 (Metek GmbH) Sampling frequency 10 Hz • EDDY CORRELATION METHOD • Turbulent Fluxes • (Heat, Momentum) • Turbulent Kinetic • Energy
RADIATION MEASUREMENTS Radiometer mod.CNR-1 (Kipp and Zonen) Radiometermeasurements - Incoming and outgoing shortwave radiation - Incoming and outgoing longwave radiation • Albedo • Surface Radiation Budget Two pyranometers(CM3) upward and downward shortwave radiation (spectral range 305-2800 nm) Two pyrgeometers (CG3 ) upward and downward longwave radiation (spectral range 5-50 μm)
TEMPERATURE AND GROUND FLUX MEASUREMENTS Conventional HFP01 heat flux plates at depth of 0, 5, 15, 30, 50 cm HEAT FLUX PLATES MEASUREMENTS Sub-surface energy fluxes THERMOMETERS Snow temperature profiles
GROUND BASED REMOTE SENSING 1- MICROWAVE TEMPERATURE PROFILER (MTP-5P) MPT-5P measurements Temperature at 18 heights Development and break down of atmospheric inversions MTP– 5P (ATTEX and Kipp&Zonen) SPECIFICATIONS: Altitude 0 –600 m Altitude resolution 0 – 50 m 10m 50 –100 m 25m >100m 50m Measurement cycle 600 sec Accuracy of temperature profile 0.5oC Central measurement frequency 60.4 GHz
GROUND BASED REMOTE SENSING 2- SODAR (Sound Detection and Ranging) • SODAR measurements • Thermal structure of the ABL • Boundary layer depth • High resolution horizontal and • vertical velocity profile) Triaxial monostatic Doppler mini-sodar SPECIFICATIONS: Range 12 - 400 m Resolution 13 m Acoustic tones frequencies : 2000 – 2500 – 3000 Hz
How to use these measurements to study the behaviour of the atmospheric boundary layer
TEMPERATURE BEHAVIOUR DURING 2005 Weekly average Clear seasonal cycle characterized by the coreless winter. Warming events of different durations occur during winter SUMMER WINTER The temperature reaches -20 °C, during the short summer and drops down to -70 °C during the long coreless winter. S. Argentini, I. Pietroni, G. Mastrantonio, A. Viola, G. Dargaud, I. Petenko, Meteorological Parameters and Energy Fluxes at Dome C, Antarctic Plateau (submitted to Journal of Geophysical Research July 2011)
WIND SPEED BEHAVIOUR DURING 2005 The highest wind velocities observed during the winter warming events and in the months of March and October. 80 % of cases from the sector 150 ° - 300 ° with the highest winds observed. S. Argentini, I. Pietroni, G. Mastrantonio, A. Viola, G. Dargaud, I. Petenko, Meteorological Parameters and Energy Fluxes at Dome C, Antarctic Plateau (submitted to Journal of Geophysical Research July 2011)
SENSIBLE HEAT FLUX BEHAVIOUR DURING 2005 Positive values occurred only in the full summer (the months of December and January). The lowest values for the sensible heat flux are observed at the end ofJune/beginning of July. The sensible heat flux is mostly negative. S. Argentini, I. Pietroni, G. Mastrantonio, A. Viola, G. Dargaud, I. Petenko, Meteorological Parameters and Energy Fluxes at Dome C, Antarctic Plateau (submitted to Journal of Geophysical Research July 2011)
RADIATIVE BUDGET DURING 2005 Summer :Jan + Feb Autumn : Feb + Apr Winter : Apr to Oct Spring : Mid-Sept to Mid-Nov Summer : Mid-Nov to End Dec S. Argentini, I. Pietroni, G. Mastrantonio, A. Viola, G. Dargaud, I. Petenko, Meteorological Parameters and Energy Fluxes at Dome C, Antarctic Plateau. (submitted to Journal of Geophysical Research July 2011)
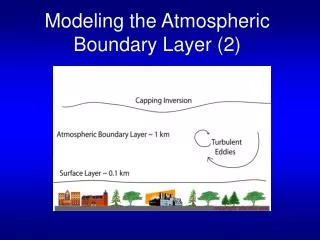
Stratified flows in the atmospheric boundary layer, depending on the stability, can be classified into three characteristic regimes: • The mixed layers which are convectively driven, unstable turbulent flows • Stable boundary layers that often accompanied by weak and sporadic turbulence • Statically neutral flows These ABL flows show greatly different turbulence structure and transport processes
Despite the small amount of sensible heat available at the snow/ice surface (Mastrantonio et al., 1999, Georgiadis et al., 2002), a weak but distinct convective activity, together with the inversion capping the mixed layer, can be clearly detected in the facsimile records. These structures are observed only during the austral summer. ConvectiveBoundaryLayerobservedduring the summer at Dome C Mastrantonio G., V. Malvestuto, S. Argentini, T. Georgiadis, A. Viola, 1999; Evidence of a convective boundary layer developing on the Antarctic plateau during the summer. Meteorol. Atmos. Phys. 71, 127-132. Georgiadis T., S. Argentini , G. Mastrantonio, A. Viola, G. Dargaud, R. Sozzi, 2002; Boundary Layer convective-like activity at Dome Concordia, Antarctica. "Il Nuovo Cimento" vol. 25 C, N.4 pag. 425-431.
Convective coherent structures delimited by a capping inversion start to be present at 0900 LST in the morning. The capping inversion reaches the maximum height around 1300 LST. Sodar facsimile records during 30 December, 1999 Ground based inversion Capping inversion Convection
ESTIMATE OF MIXED LAYER HEIGHT The mixed layer height h (or mixing height) is generally estimated from radio soundings or tethersonde vertical profiles as the height of the temperature inversion or modelled using diagnostic or prognostic models. Moreover, h can be estimated directly from the sodar echogram as the height of the intense echo layer capping the convection if it is within the range of the sodar measurements. Argentini S., A. Viola, A. Sempreviva, I. Petenko, 2005; Summer PBL height at the plateau site of Dome C, Antarctica. Boundary Layer Meteorology. Vol. 115 Number 3, 409-422
Determinationofinversionheightusing SODAR data The inversion height was estimated looking for the maxima in the backscattered echo signal profiles. The harmonic analysis of the signal (not shown in this graph), carried out to prove the existence of convective activity, showed the vertical velocity field pattern, typical of convection up to 100 m, with upward velocities reaching 1 m s-1.
Mean daily mixed layer height, estimated from sodar data during the 1999-2000 summer field experiment.
PBL height behaviour (a) and net radiation (b) during the period 23 December 1999 – 2 February 2000. The solid line indicates the polynomial second order fitting to the experimental data.
COMPARISON BETWEEN MIXED LAYER HEIGHT ESTIMATED FROM SODAR DATA AND MTP– 5P The mixed layer height was determined applying the advanced parcel method (Holzworth, 1972; Holtslag et al. ,1990) to the MTP- 5P data. 27 January 2005 Considering the error attributed to sodar determination of mixed layer height, a substantial agreement can be noted throughout the day. Maximum reached at 1400 SLT Pietroni I., S. Argentini, I. Petenko, Measurements and parametrizations of the atmospheric boundary layer height at Dome C, Antarctica (Submitted to Boundary Layer Meteorology)
Considering the entire observation period the following parameters was found: R= 0.80 RMSE= 41 m mean difference = 14 m In January and February the mixed layer height ranges between 30 and 350 m. Pietroni I., S. Argentini, I. Petenko, Measurements and parametrizations of the atmospheric boundary layer height at Dome C, Antarctica (Submitted to Boundary Layer Meteorology)
StableBoundaryLayerobservedduring the winter Wind shear absent SIGNAL IF PRESENT BELOW THE FIRST RANGE GATE
Higher resolution needed in the near proximity of the ground and the very narrow layer of interest (about 150 m) suggests the use of high acoustic frequencies. In order to monitor the winter as well the summer boundary layer structure we plan to develop a new high resolution mini-Sodar system which can work in two modes: - very high resolution (resolution 2.5 meters – first range gate 5 m – maximum range 150 m) during the winter - high resolution (resolution 5meters – first range gate 10 m – maximum range 300 m) during the summer This system will be used in a configuration which will use 3 emitting antennas and one receiving antenna in order to increase the signal to noise ratio. The new mini-sodar has been done in a way to minimize all the hardware parts which at low temperature are those which give the major problems.
Colour zone graphic of potential temperature gradient The strongest temperature gradients Occur below 50 m. WINTER SUMMER
Argentini S. , I. V. Petenko, G. Mastrantonio, V. A. Bezverkhnii, and A. P. Viola, 2001; Spectral characteristics of East Antarctica Meteorological Parameters during 1994. J. Geophysical Research, Vol. 106, N° D12, p. 12463-12476.
Argentini S. , I. V. Petenko, G. Mastrantonio, V. A. Bezverkhnii, and A. P. Viola, 2001; Spectral characteristics of East Antarctica Meteorological Parameters during 1994. J. of Geophysical Research, Vol. 106, N° D12, p. 12463-12476. Naithani J., G. Mastrantonio, S. Argentini, P. Pettré, 2001; Influence of cyclonic perturbations on surface winds around Dumont d’ Urville, East Antarctica. J. of Geophysical Research Vol. 106, N° D15, p 17093-17102. Argentini S., A. Viola, A. Sempreviva, I. Petenko, 2005; Summer PBL height at the plateau site of Dome C, Antarctica. Boundary Layer Meteorology. Vol. 115 Number 3, 409-422. King J.C., Argentini S., P. Anderson, 2006. Contrasts between the summertime surface energy balance and boundary layer structure at Dome C and Halley stations, Antarctica. J. of Geophysical Research Vol. 3 D02105. Genthon C. , D. Six, V. Favier, S. Argentini. A. Pellegrini, 2010, Meteorological Atmospheric Boundary Layer Meteorological Measurements and ECMWF analeses during summer at Dome C, Antarctica, JOURNAL OF GEOPHYSICAL RESEARCH, VOL. 115, D05104, 12 PP., 2010 doi:10.1029/2009JD012741 Argentini S. and I. Pietroni, 2010, An Integrated Observing System for Boundary Layer Monitoring at Concordia Station, Antarctica. Chapter book of "Integrated Ground-Based Observing Systems - Applications for Climate, Meteorology, and Civil Protection", Cimini, Marzano, and Visconti Eds., Springer, ISBN 978-3-642-12967-1, DOI: 10.1007/978-3-642-12968-1, 2010. Petenko I., G. Mastrantonio, A. Viola, S. Argentini, L. Coniglio, P. Monti, G. Leuzzi, 2011 Local circulation diurnal patterns and their relationship with large-scale flows in a coastal area of the Tyrrhenian Sea. Submitted to Boundary Layer Meteorology 139, Issue 2, pag. 353-366. Argentini S. and I. Pietroni. Atmospheric Observations at Dome C, Antarctic Plateau, one of the coldest place in the world. Chapter of the book “ ANTARCTICA : THE MOST INTERACTIVE ICE-AIR-OCEAN ENVIRONMENT”. Jaswant Singh, H. N. Dutta Eds. Nova Science Publishers, Inc. ISBN: 978-1-61122-815-1, 2011 Argentini, S., G. Mastrantonio, I.Petenko, I. Pietroni, A.Viola, 2011 A high resolution sodar for the study of turbulent structures in the surface layer. Submitted to Boundary Layer Meteorology (accepted in press). Argentini S., I. Pietroni, G. Mastrantonio, A. Viola, G. Dargaud, I. Petenko, 2011. Meteorological Parameters and Energy Fluxes at Dome C, Antarctic Plateau. Submitted to J. Geophys. Res (accepted under revision). Pietroni I., S. Argentini, I. Petenko, 2010. Measurements and parameterization of the atmospheric boundary layer height at Dome C, Antarctica. Submitted to Boundary Layer Meteorology (accepted in press).