Containership Market
150 likes | 169 Views
This report analyzes the market share evolution of containership operators from 2000 to 2007 and explores the charter market and evolution of the cellular fleet during the same period.

Containership Market
E N D
Presentation Transcript
Containership Market Fonasba Annual Meeting Centro de Navegación Eng. Rodolfo Garcia Piñeiro Buenos Aires, October 10th. 2007
Executive summary • The market share evolution during 2000 – 2007 • The operators • The charter market • Evolution of the cellular fleet
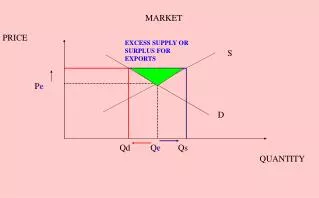
The market share evolution during 2000 - 2007 • Between January 2000 and January 2007, the teu capacity on liner trades has more than doubled. It has risen from 5,150,000 teu to 10,467,000 teu. • This means that in order to simply keep their market shares during that period, carriers had to increase their fleet capacity by 103 %. • The collective market share of the three world leading lines, Maersk Line, MSC and CMA CGM, has grown from 32,4 % to 33,1 % in terms of teu capacity during the year 2006. • However, the growth in 2006 was far from being equally shared by the three leading lines. Maersk Line still dominated the market with a share of 16,8 % on 1st. January 2007 but this was less than the 18,2 % of an year ago, reflecting the dificulties the company experienced in integrating P&O Nedlloyd. • On the contrary, both MSC and CMA CGM have clearly strengthened their positions. MSC has increased its share from 8,6 % to 9,5 % while CMA CGM logged an increase from 5,6 % to 6,5 %.
The operators • Most large carriers have lost money during 2006, or at least made much smaller profits than in 2005. • The main reasons lie in a fall in box rates coupled with high bunker costs and charter hire burdens from costly charters concluded at the peak of th market in mid 2005. • A seasoned optimism leads to think that profits will be back in 2007 thanks to rise in box rates. • Some carriers with a strong regional bias are also doing well, although for them, the concept of global market share is of low significance, which also means that their regional market shares has grown still stronger (eg. IRIS LINES, Hamburg-Süd and PIL). • Japanese lines NYK, MOL an K Line have managed to maintain more or less their shares, and they are no longer as expansive as they used to be during the previous decades, although K Line displayed more dynamics than its fellow counterparts. • Those who win market share get it of course at the expense of rivals. • COSCO Container Lines has seen its market share decrease by nine points during the period 2000-2005 but is has recovered some of the loss since mid 2005, an interesting trend as it has been listed on the HKSE in June 2005.
Top 15 container shipping lines Source: CEPAL
Concentration of transport Containership Lines representing 50 % of capacity (Teu’s) * After P&O Nedlloyd ** After CP Ships
The charter market • The rates have begun to rise again in early 2007. The charter activity picked up strongly in January and the feeling is that there will not be enough ships around, despite the 1,5 millon teu capacity wich are to enter into the market in 2007. • In 2006, 691 fixtures for ships of more than 1000 teu were recorded. That is 25 % higher than in 2005, but still well under the 1100 to 1400 fixtures recorded annually in 2002 – 2004. • Part of the explanation lies in the high number of 24-36 months fixtures in 2005, which has dried up the pool of redelivered ships in 2006. • The market remains dominated by a few players. In 2007, A.P. Moller Maersk, MSC an CMA CGM contributed to 30 % of the chartering activity for ships larger than 1000 teu.
Charter rates for containerships Fuente: Axs-Alphaliner
Evolution of the cellular fleet • The cellular fleet will grow from 9,6 million teu in January 2007 to 14 million teu in January 2010, taking into account the existing orderbook and without demolition. • Some reasonable demolition will probably roughly compensate the few more orders that will be concluded for 2009 deliveries. The anual fleet growth will then stand at 13.5 % on average during the three years to come. • After the 16 % increase recorded in 2006, the fleet is expected increase by 15.7 % during 2007 and 14.7 % during 2008. • In 2006, 401 cellular ships for 1.6 million teu were contacted, at global value of $ 24.2 billion. • On the 1st January 2007, the orderbook stood at 4.7 million teu, representing 49.5 % of existing fleet, down ffrom 60 % at its peak in July 2005. Orders stretch until end 2010 for large ships. • The VLCS fleet (ships over 7,500 teu) comprises 147 ships in service and 160 or order. • Only 25,000 teu have been scrapped for the whole of 2006, after an absence of scrapping in 2005.
New generation of container ships M/V Emma Maersk at Rotterdam.
M/V Emma Maersk Loa 397 m. Breadth 63 m. Draft 16 m. Speed 30 mph Crew 13 Cost 145 mi. u$d