Download

1 / 29
290 likes | 384 Views
Web-based Interrogation & Control of a Power Quality Data Acquisition Device. DESIGN TEAM:. Dr. Mark Halpin. Glenn Wilson. Team Advisor. Team Leader Web Page Software Research & Design. Jason Koberger True RMS meter Research & Design Hardware Testing & Simulation. Melissa Wilson

E N D
Web-based Interrogation & Control of a Power QualityData Acquisition Device
DESIGN TEAM: Dr. Mark Halpin Glenn Wilson Team Advisor Team Leader Web Page Software Research & Design Jason Koberger True RMS meter Research & Design Hardware Testing & Simulation Melissa Wilson Documentation True RMS meter Research, Design & Simulation
Need for improved data acquisition device for Southern Company Southern Company is our Co-op employer Motivation
Problem • Signal Information is not Readily Available • Remotely • Nonexistent • On-site • Must have computer available
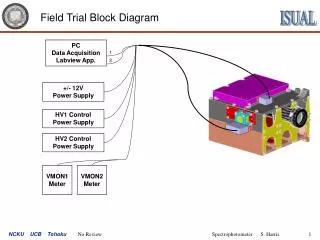
Approach • On-site • 4-Channel Voltmeter • LCD Display Added • Good/Bad Signal Indicator • Button(s) to Cycle Through LCD Data
Design Requirements • Accuracy:For voltage readings, the circuitry and display must begin reading at a minimum of 1 V and accurately read for low and high voltages. The RMS meter must also function as a true RMS meter.
Design Requirements • Temperature: Circuitry must withstand 0 C minimum and 50 C maximum.
Design Requirements • Physical Packaging: All design additions to the existing power quality device must be limited in size in order to fit in the existing box.
Squared Integrated over 1 period RMS Output Signal Square Root Flow Diagram Incoming Signal
Log Anti-Log x2 Miller Integrator RMS output Log Anti-Log x Flow Diagram Input Signal
Circuit 1 Meter Design from Electronic Design News
Simulation Results Vrms(actual) = 148.49 V Percent Error = 2.45 %
Simulation Results Vrms(actual)=1.1 V Is this REALLY a true RMS meter?
Peak RMS: True RMS: ≈ 0.7778 Vrms = 1.1 Vrms Proof: Simulated value: Vrms = 0.77649 V
Circuit 2 Maxim RMS circuit
Accuracy Results Vrms(actual) = 0.7071 V Percent Error = 0.15 %
Accuracy Results Vrms(actual) = 148.49 V Percent Error = 0.15 %
Accuracy Results Vrms(actual) = 1.1 V Percent Error = 0.18 %
Temperature Results All simulation values between 147.95 V and 148.64 V. Less than 1% error!!!
Temperature Results From 0º C to 50º C the % error is <1%
6.3356 0.7093 3.7256 LCD Display 0.9379 3.5598 1 2 3 4 5 6 7 8 Note: All dimensions are in inches Physical Packaging Results
Conclusions • Our circuit functions as a true RMS circuit. • The true RMS circuit can accurately read low and high voltages, as well as non-sinusoidal waveforms. • It operates properly throughout the required temperature range of 0º C to 50º C. • All circuitry can conform to the existing device.
Future Work • Implement this circuit design in hardware form • Add display circuitry and current reading functionality • Implement remote interface
References [1] “Home Power Quality,” http://energyoutlet.com/res/powerqual/index.html, Energy Outlet, Iris Communications, Inc, USA, 1996. [2] R. C. Dugan, M. F. McGranaghan, and H. W. Beaty, Electrical Power Systems Quality, McGraw-Hill, New York, New York, USA, p. 1-3, 1996. [3] W. M. Grady and A. H. Noyola, “End User and Electric Utility Perspectives,” Results of Power Quality Surveys in the United States, University of Texas at Austin, Austin, Texas, USA, 1995. [4] C. Peacock, “Interfacing the PC, ” http://www.beyondlogic.org/serial/serial3.htm, USA, February 28, 2000.
References [5] T. Cambra, “Developing a Visual Basic Component for IIS/MTS,” http://msdn.microsoft.com/workshop/server/components/vbmtsiis.asp, Microsoft Development Network, USA, June 19, 1998. [6] D. Adair, J. Ball, and M. Pawlan, “Trail: 2D Graphics,” http://web2.java.sun.com/ docs/books/tutorial/2d/index.html, Sun Microsystems, USA. [7] P. Coleman and M. Halpin, “Long Term Monitoring”, 1999 Southeastern Meter School & Conference, pp. 2-3, Birmingham, Alabama, USA, 1999. [8] W. Berry, “COM Objects and ASP,” http://msdn.microsoft.com/workshop/server/ asp/comtutorial.asp, Microsoft Development Network, USA, January 12, 1998.
References [9] “LCD Products,” http://www.eio.com/lcdprodt.htm, Electronics Information Online, USA, August 23, 2000. [10] “Newark Electronics” http://www.newark.com, Newark Electronics, USA, 2000. [11] R. Moffat, “ElectronicsCooling”, http://www.electronics-cooling.com/Resources/ECArticles/JAN97/jan97-01.htm, Stanford University, Stanford, California, USA, January 1997. [12] “California Instruments: Programmable AC Power Sources”, http://www.ixpres.com/calinst/acpower.htm, California Instruments, San Diego, California, USA, September 2000.