Download

1 / 19
190 likes | 203 Views
This community service system aims to provide accessible and affordable transportation options for older adults, allowing them to live comfortably and safely at home. The system also mobilizes caregivers to complement formal services.

E N D
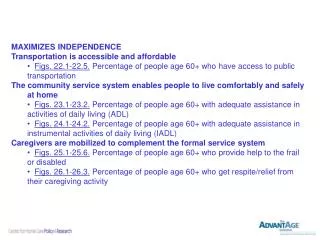
MAXIMIZES INDEPENDENCE Transportation is accessible and affordable • Figs. 22.1-22.5. Percentage of people age 60+ who have access to public transportation The community service system enables people to live comfortably and safely at home • Figs. 23.1-23.2. Percentage of people age 60+ with adequate assistance in activities of daily living (ADL) • Figs. 24.1-24.2. Percentage of people age 60+ with adequate assistance in instrumental activities of daily living (IADL) Caregivers are mobilized to complement the formal service system • Figs. 25.1-25.6. Percentage of people age 60+ who provide help to the frail or disabled • Figs. 26.1-26.3. Percentage of people age 60+ who get respite/relief from their caregiving activity
Figure 22.1, Indiana-Area 10§ Percentage of people age 60+ who have access to public transportation* Yes, but too limited to be useful Don’t know 2% No 25% ‡ 4% ‡ Yes 69% Unweighted N=300 Weighted N=20,900 Note: Percentages may not add up to 100% due to rounding and/or missing information. *People were asked whether public transportation is available in their community. ‡ This percentage is based on fewer than 20 respondents (Unweighted N<20) and should be interpreted with caution. § Area 10 includes Monroe and Owen Counties. Source: AdvantAge Initiative Community Survey in Indiana 2008
Figure 22.2, Indiana-Area 10§ Frequency of use of public transportation in the past two months* Never 69% Two or more days a week 2% ‡ ‡ About once/week, 1% Public transportation does not exist/DK/RF 27% Unweighted N=300 Weighted N=20,900 Once or twice/month 1% ‡ Less than once/month <1% ‡ Note: Percentages may not add up to 100% due to rounding and/or missing information. *People were asked how often they have used public transportation during the past two months. ‡ This percentage is based on fewer than 20 respondents (Unweighted N<20) and should be interpreted with caution. § Area 10 includes Monroe and Owen Counties. Source: AdvantAge Initiative Community Survey in Indiana 2008
Figure 22.3, Indiana-Area 10§ Means of transportation used most frequently* Ride in a car 9% Public Transportation 2% Drive a car 87% ‡ Other** 2% ‡ Unweighted N=300 Weighted N=20,900 Note: Percentages may not add up to 100% due to rounding and/or missing information. *People were asked which means of transportation they use most frequently. **Includes taxi, walk, special transportation, and other. ‡ This percentage is based on fewer than 20 respondents (Unweighted N<20) and should be interpreted with caution. § Area 10 includes Monroe and Owen Counties. Source: AdvantAge Initiative Community Survey in Indiana 2008
Figure 22.4, Indiana-Area 10§ Means of transportation used most frequently,* by demographics ‡ ‡ Total ‡ ‡ ‡ Age 60-64 ‡ ‡ Age 65-74 ‡ ‡ Age 75+ ‡ ‡ ‡ Women ‡ ‡ Men ‡ ‡ Note: Percentages may not add up to 100% due to rounding and/or missing information. Unweighted N=300 Weighted N=20,900 *People were asked which means of transportation they use most frequently. **Includes taxi, walk, special transportation, and other. ‡ This percentage is based on fewer than 20 respondents (Unweighted N<20) and should be interpreted with caution. § Area 10 includes Monroe and Owen Counties. Source: AdvantAge Initiative Community Survey in Indiana 2008
Figure 22.5, Indiana-Area 10§ Means of transportation used most frequently,* by demographics (cont’d) ‡ ‡ Total ‡ ‡ Education >HS ‡ ‡ ‡ Education <HS ‡ ‡ Ex/vg/good health ‡ ‡ ‡ ‡ Fair/poor health ‡ Live w/others ‡ ‡ ‡ ‡ ‡ Live alone Note: Percentages may not add up to 100% due to rounding and/or missing information. Unweighted N=300 Weighted N=20,900 *People were asked which means of transportation they use most frequently. **Includes taxi, walk, special transportation, and other. ‡ This percentage is based on fewer than 20 respondents (Unweighted N<20) and should be interpreted with caution. § Area 10 includes Monroe and Owen Counties. Source: AdvantAge Initiative Community Survey in Indiana 2008
Figure 23.1, Indiana-Area 10§ Percentage of people age 60+ with adequate assistance* in activities of daily living (ADL) 1 or more unmet need 3.2% All needs are met 1.8% 1+ADL 5.0% ‡ ‡ ‡ No limitations 95% Unweighted N=300 Weighted N=20,900 Note: Percentages may not add up to 100% due to rounding and/or missing information. *People were asked whether they need assistance with the following activities (ADLs): taking a bath or a shower, dressing, eating, getting in/out of bed/chair, using/getting to a toilet, getting around inside the home. Those who answered “yes” were asked whether they get enough assistance with these activities. ‡ This percentage is based on fewer than 20 respondents (Unweighted N<20) and should be interpreted with caution. § Area 10 includes Monroe and Owen Counties. Source: AdvantAge Initiative Community Survey in Indiana 2008
Figure 23.2, Indiana-Area 10§ Percentage of people age 60+ who need assistance with each activity of daily living* Getting in/out bed/chair ‡ Getting around the home ‡ Taking a bath or shower ‡ ‡ Dressing Using/getting to the toilet ‡ Unweighted N=300 Weighted N=20,900 Eating *People were asked whether they have a problem or need help with each of the above activities. ‡ This percentage is based on fewer than 20 respondents (Unweighted N<20) and should be interpreted with caution. § Area 10 includes Monroe and Owen Counties. Source: AdvantAge Initiative Community Survey in Indiana 2008
Figure 24.1, Indiana-Area 10§ Percentage of people age 60+ with adequate assistance* in instrumental activities of daily living (IADL) 1 or more unmet need 6.7% All needs are met 6.1% 1+IADL 12.8% ‡ No limitations 87.2% Unweighted N=300 Weighted N=20,900 Note: Percentages may not add up to 100% due to rounding and/or missing information. *People were asked whether they need assistance with the following activities (IADLs): going outside the home, doing light housework, preparing meals, driving a car/using public transportation, taking the right amount of prescribed medication, keeping track of money and bills. Those who answered “yes” were asked whether they get enough assistance with these activities. ‡ This percentage is based on fewer than 20 respondents (Unweighted N<20) and should be interpreted with caution. § Area 10 includes Monroe and Owen Counties. Source: AdvantAge Initiative Community Survey in Indiana 2008
Figure 24.2, Indiana-Area 10§ Percentage of people age 60+ who need assistance with each instrumental activity of daily living* Driving or public transportation ‡ Doing light housework ‡ Going outside the home ‡ Keeping track of money or bills ‡ Taking the right amount of medication ‡ Unweighted N=300 Weighted N=20,900 ‡ Preparing meals *People were asked whether they have a problem or need help with each of the above activities. ‡ This percentage is based on fewer than 20 respondents (Unweighted N<20) and should be interpreted with caution. § Area 10 includes Monroe and Owen Counties. Source: AdvantAge Initiative Community Survey in Indiana 2008
Figure 25.1, Indiana-Area 10§ Percentage of people age 60+ who provide help to the frail or disabled* Provide care 25% Do not provide care 75% Unweighted N=300 Weighted N=20,900 Note: Percentages may not add up to 100% due to rounding and/or missing information. *People were asked whether they provide help or care, or arrange for help or care, for a relative or friend who is unable to do some things for him/herself due to illness or disability. § Area 10 includes Monroe and Owen Counties. Source: AdvantAge Initiative Community Survey in Indiana 2008
Figure 25.2, Indiana-Area 10§ Percentage of people age 60+ who provide help to the frail or disabled,* by demographics Total Age 60-64 Age 65-74 ‡ Age 75+ Women Men Unweighted N=300 Weighted N=20,900 *People were asked whether they provide help or care, or arrange for help or care, for a relative or friend who is unable to do some things for him/herself due to illness or disability. ‡ This percentage is based on fewer than 20 respondents (Unweighted N<20) and should be interpreted with caution. § Area 10 includes Monroe and Owen Counties. Source: AdvantAge Initiative Community Survey in Indiana 2008
Figure 25.3, Indiana-Area 10§ Percentage of people age 60+ who provide help to the frail or disabled,* by demographics (cont’d) Total Education >HS Education <HS Ex/vg/good health ‡ Fair/poor health Live w/others Live alone Unweighted N=300 Weighted N=20,900 *People were asked whether they provide help or care, or arrange for help or care, for a relative or friend who is unable to do some things for him/herself due to illness or disability. ‡ This percentage is based on fewer than 20 respondents (Unweighted N<20) and should be interpreted with caution. § Area 10 includes Monroe and Owen Counties. Source: AdvantAge Initiative Community Survey in Indiana 2008
Figure 25.4, Indiana-Area 10§ Relationship between caregivers age 60+ and care recipients* Non-relative friend Parent or in-law Spouse/partner ‡ Another relative ‡ ‡ Child 0% Other Unweighted N=78 Weighted N=5,305 Note: Percentages may not add up to 100% due to rounding and/or missing information. *People who said they provide care were asked “What is this person’s relationship to you?” ‡ This percentage is based on fewer than 20 respondents (Unweighted N<20) and should be interpreted with caution. § Area 10 includes Monroe and Owen Counties. Source: AdvantAge Initiative Community Survey in Indiana 2008
Figure 25.5, Indiana-Area 10§ Number of years people age 60+ provide help to the frail or disabled among those who provide help* More than 3 years 43% Don’t know 2% ‡ 1-3 years 30% <1 year 25% ‡ Unweighted N=78 Weighted N=5,305 Note: Percentages may not add up to 100% due to rounding and/or missing information. *People who said they provide care were asked “In total, how long have you been caring for … ” ‡ This percentage is based on fewer than 20 respondents (Unweighted N<20) and should be interpreted with caution. § Area 10 includes Monroe and Owen Counties. Source: AdvantAge Initiative Community Survey in Indiana 2008
Figure 25.6, Indiana-Area 10§ Number of hours per week spent on caregiving among people age 60+ who provide help to the frail or disabled* More than 10 hours 26% Don’t know 11% 4-10 hours 27% ‡ 1-3 hours 36% Unweighted N=78 Weighted N=5,305 Note: Percentages may not add up to 100% due to rounding and/or missing information. *People who said they provide care were asked “On average how many hours per week are you caring for … ” ‡ This percentage is based on fewer than 20 respondents (Unweighted N<20) and should be interpreted with caution. § Area 10 includes Monroe and Owen Counties. Source: AdvantAge Initiative Community Survey in Indiana 2008
Figure 26.1, Indiana-Area 10§ Percentage of people age 60+ who get respite/relief from their caregiving activity* DK/RF 2% ‡ No respite 30% Do not provide caregiving 75% Provide caregiving 25% Get respite 68% Unweighted N=300 Weighted N=20,900 Unweighted N=78 Weighted N=5,305 *People were asked whether they provide help or care, or arrange for help or care, for a relative or friend who is unable to do some things for him/herself due to illness or disability. *People were asked whether they get relief from their caregiving responsibilities. Note: Percentages may not add up to 100% due to rounding and/or missing information. ‡ This percentage is based on fewer than 20 respondents (Unweighted N<20) and should be interpreted with caution. § Area 10 includes Monroe and Owen Counties. Source: AdvantAge Initiative Community Survey in Indiana 2008
Figure 26.2, Indiana-Area 10§ Percentage of people age 60+ who get respite/relief from their caregiving activity,* by demographics Base: People age 65+ who provide caregiving Total ‡ ‡ Age 60-64 ‡ Age 65-74 ‡ ‡ Age 75+ ‡ Women ‡ Men Note: Percentages may not add up to 100% due to rounding and/or missing information. Unweighted N=78 Weighted N=5,305 *People were asked whether they get relief from their caregiving responsibilities. ‡ This percentage is based on fewer than 20 respondents (Unweighted N<20) and should be interpreted with caution. § Area 10 includes Monroe and Owen Counties. Source: AdvantAge Initiative Community Survey in Indiana 2008
Figure 26.3, Indiana-Area 10§ Percentage of people age 60+ who get respite/relief from their caregiving activity,* by demographics (cont’d) Base: People age 65+ who provide caregiving Total ‡ Education >HS ‡ Education <HS Ex/vg/good health ‡ ‡ Fair/poor health Live w/others ‡ ‡ Live alone Note: Percentages may not add up to 100% due to rounding and/or missing information. Unweighted N=78 Weighted N=5,305 *People were asked whether they get relief from their caregiving responsibilities. ‡ This percentage is based on fewer than 20 respondents (Unweighted N<20) and should be interpreted with caution. § Area 10 includes Monroe and Owen Counties. Source: AdvantAge Initiative Community Survey in Indiana 2008


![Independence and Safety with Affordable Home Care [Infographic]](https://cdn4.slideserve.com/7239623/slide1-dt.jpg)