Download
1 / 19
190 likes | 316 Views
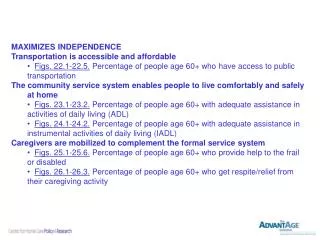
MAXIMIZES INDEPENDENCE Transportation is accessible and affordable • Figs. 22.1-22.5. Percentage of people age 60+ who have access to public transportation The community service system enables people to live comfortably and safely at home

E N D
MAXIMIZES INDEPENDENCE Transportation is accessible and affordable • Figs. 22.1-22.5. Percentage of people age 60+ who have access to public transportation The community service system enables people to live comfortably and safely at home • Figs. 23.1-23.2. Percentage of people age 60+ with adequate assistance in activities of daily living (ADL) • Figs. 24.1-24.2. Percentage of people age 60+ with adequate assistance in instrumental activities of daily living (IADL) Caregivers are mobilized to complement the formal service system • Figs. 25.1-25.6. Percentage of people age 60+ who provide help to the frail or disabled • Figs. 26.1-26.3. Percentage of people age 60+ who get respite/relief from their caregiving activity
Figure 22.1, Indiana-Area 3§ Percentage of people age 60+ who have access to public transportation* No 45% Yes, but too limited to be useful Don’t know 6% ‡ 5% ‡ Yes 45% Unweighted N=300 Weighted N=106,028 Note: Percentages may not add up to 100% due to rounding and/or missing information. *People were asked whether public transportation is available in their community. ‡ This percentage is based on fewer than 20 respondents (Unweighted N<20) and should be interpreted with caution. § Area 3 includes Adams, Allen, De Kalb, Huntington, Lagrange, Noble, Steuben, Wells, & Whitley Counties. Source: AdvantAge Initiative Community Survey in Indiana 2008
Figure 22.2, Indiana-Area 3§ Frequency of use of public transportation in the past two months* Never 48% ‡ About once/week, <1% ‡ Less than once/month, 1% Public transportation does not exist/DK/RF 50% Unweighted N=300 Weighted N=106,028 Note: Percentages may not add up to 100% due to rounding and/or missing information. *People were asked how often they have used public transportation during the past two months. ‡ This percentage is based on fewer than 20 respondents (Unweighted N<20) and should be interpreted with caution. § Area 3 includes Adams, Allen, De Kalb, Huntington, Lagrange, Noble, Steuben, Wells, & Whitley Counties. Source: AdvantAge Initiative Community Survey in Indiana 2008
Figure 22.3, Indiana-Area 3§ Means of transportation used most frequently* Ride in a car 13% Drive a car 87% Public transportation <1% ‡ Other,** <1% ‡ Unweighted N=300 Weighted N=106,028 Note: Percentages may not add up to 100% due to rounding and/or missing information. *People were asked which means of transportation they use most frequently. **Includes taxi, walk, special transportation, and other. ‡ This percentage is based on fewer than 20 respondents (Unweighted N<20) and should be interpreted with caution. § Area 3 includes Adams, Allen, De Kalb, Huntington, Lagrange, Noble, Steuben, Wells, & Whitley Counties. Source: AdvantAge Initiative Community Survey in Indiana 2008
Figure 22.4, Indiana-Area 3§ Means of transportation used most frequently,* by demographics ‡ ‡ Total Age 60-64 ‡ Age 65-74 ‡ ‡ ‡ Age 75+ ‡ ‡ Women ‡ Men ‡ Unweighted N= 300 Weighted N= 106,028 Note: Percentages may not add up to 100% due to rounding and/or missing information. *People were asked which means of transportation they use most frequently. **Includes taxi, walk, special transportation, and other. ‡ This percentage is based on fewer than 20 respondents (Unweighted N<20) and should be interpreted with caution. § Area 3 includes Adams, Allen, De Kalb, Huntington, Lagrange, Noble, Steuben, Wells, & Whitley Counties. Source: AdvantAge Initiative Community Survey in Indiana 2008
Figure 22.5, Indiana-Area 3§ Means of transportation used most frequently,* by demographics (cont’d) ‡ ‡ Total Education >HS ‡ ‡ Education <HS ‡ ‡ ‡ Ex/vg/good health ‡ Fair/poor health Live w/others ‡ ‡ ‡ Live alone Unweighted N= 300 Weighted N= 106,028 Note: Percentages may not add up to 100% due to rounding and/or missing information. *People were asked which means of transportation they use most frequently. **Includes taxi, walk, special transportation, and other. ‡ This percentage is based on fewer than 20 respondents (Unweighted N<20) and should be interpreted with caution. § Area 3 includes Adams, Allen, De Kalb, Huntington, Lagrange, Noble, Steuben, Wells, & Whitley Counties. Source: AdvantAge Initiative Community Survey in Indiana 2008
Figure 23.1, Indiana-Area 3§ Percentage of people age 60+ with adequate assistance* in activities of daily living (ADL) 1 or more unmet need 4.1% All needs are met 2.9% 1+ADL 7.0% ‡ ‡ No limitations 93.0% Unweighted N=300 Weighted N=106,028 Note: Percentages may not add up to 100% due to rounding and/or missing information. *People were asked whether they need assistance with the following activities (ADLs): taking a bath or a shower, dressing, eating, getting in/out of bed/chair, using/getting to a toilet, getting around inside the home. Those who answered “yes” were asked whether they get enough assistance with these activities. ‡ This percentage is based on fewer than 20 respondents (Unweighted N<20) and should be interpreted with caution. § Area 3 includes Adams, Allen, De Kalb, Huntington, Lagrange, Noble, Steuben, Wells, & Whitley Counties. Source: AdvantAge Initiative Community Survey in Indiana 2008
Figure 23.2, Indiana-Area 3§ Percentage of people age 60+ who need assistance with each activity of daily living* ‡ Dressing Getting in/out bed/chair ‡ Taking a bath or shower ‡ ‡ Getting around the home ‡ Using/getting to the toilet Unweighted N=300 Weighted N=106,028 ‡ Eating *People were asked whether they have a problem or need help with each of the above activities. ‡ This percentage is based on fewer than 20 respondents (Unweighted N<20) and should be interpreted with caution. § Area 3 includes Adams, Allen, De Kalb, Huntington, Lagrange, Noble, Steuben, Wells, & Whitley Counties. Source: AdvantAge Initiative Community Survey in Indiana 2008
Figure 24.1, Indiana-Area 3§ Percentage of people age 60+ with adequate assistance* in instrumental activities of daily living (IADL) 1 or more unmet need 5.7% All needs are met 5.7% 1+IADL 11.4% ‡ ‡ No limitations 88.6% Unweighted N=300 Weighted N=106,028 Note: Percentages may not add up to 100% due to rounding and/or missing information. *People were asked whether they need assistance with the following activities (IADLs): going outside the home, doing light housework, preparing meals, driving a car/using public transportation, taking the right amount of prescribed medication, keeping track of money and bills. Those who answered “yes” were asked whether they get enough assistance with these activities. ‡ This percentage is based on fewer than 20 respondents (Unweighted N<20) and should be interpreted with caution. § Area 3 includes Adams, Allen, De Kalb, Huntington, Lagrange, Noble, Steuben, Wells, & Whitley Counties. Source: AdvantAge Initiative Community Survey in Indiana 2008
Figure 24.2, Indiana-Area 3§ Percentage of people age 60+ who need assistance with each instrumental activity of daily living* Driving or public transportation ‡ Going outside the home ‡ Doing light housework ‡ Keeping track of money or bills ‡ ‡ Preparing meals Unweighted N=300 Weighted N=106,028 Taking the right amount of medication ‡ *People were asked whether they have a problem or need help with each of the above activities. ‡ This percentage is based on fewer than 20 respondents (Unweighted N<20) and should be interpreted with caution. § Area 3 includes Adams, Allen, De Kalb, Huntington, Lagrange, Noble, Steuben, Wells, & Whitley Counties. Source: AdvantAge Initiative Community Survey in Indiana 2008
Figure 25.1, Indiana-Area 3§ Percentage of people age 60+ who provide help to the frail or disabled* DK/RF <1% ‡ Provide care 21% Do not provide care 79% Unweighted N=300 Weighted N=106,028 Note: Percentages may not add up to 100% due to rounding and/or missing information. *People were asked whether they provide help or care, or arrange for help or care, for a relative or friend who is unable to do some things for him/herself due to illness or disability. ‡ This percentage is based on fewer than 20 respondents (Unweighted N<20) and should be interpreted with caution. § Area 3 includes Adams, Allen, De Kalb, Huntington, Lagrange, Noble, Steuben, Wells, & Whitley Counties. Source: AdvantAge Initiative Community Survey in Indiana 2008
Figure 25.2, Indiana-Area 3§ Percentage of people age 60+ who provide help to the frail or disabled,* by demographics Total ‡ Age 60-64 Age 65-74 ‡ Age 75+ Women Men Unweighted N= 300 Weighted N= 106,028 *People were asked whether they provide help or care, or arrange for help or care, for a relative or friend who is unable to do some things for him/herself due to illness or disability. ‡ This percentage is based on fewer than 20 respondents (Unweighted N<20) and should be interpreted with caution. § Area 3 includes Adams, Allen, De Kalb, Huntington, Lagrange, Noble, Steuben, Wells, & Whitley Counties. Source: AdvantAge Initiative Community Survey in Indiana 2008
Figure 25.3, Indiana-Area 3§ Percentage of people age 60+ who provide help to the frail or disabled,* by demographics (cont’d) Total Education >HS Education <HS Ex/vg/good health ‡ Fair/poor health Live w/others ‡ Live alone Unweighted N= 300 Weighted N= 106,028 *People were asked whether they provide help or care, or arrange for help or care, for a relative or friend who is unable to do some things for him/herself due to illness or disability. ‡ This percentage is based on fewer than 20 respondents (Unweighted N<20) and should be interpreted with caution. § Area 3 includes Adams, Allen, De Kalb, Huntington, Lagrange, Noble, Steuben, Wells, & Whitley Counties. Source: AdvantAge Initiative Community Survey in Indiana 2008
Figure 25.4, Indiana-Area 3§ Relationship between caregivers age 60+ and care recipients* Non-relative friend ‡ Parent or in-law Spouse/partner ‡ ‡ Another relative ‡ Child Other 0% Unweighted N=62 Weighted N=22,172 Note: Percentages may not add up to 100% due to rounding and/or missing information. *People who said they provide care were asked “What is this person’s relationship to you?” ‡ This percentage is based on fewer than 20 respondents (Unweighted N<20) and should be interpreted with caution. § Area 3 includes Adams, Allen, De Kalb, Huntington, Lagrange, Noble, Steuben, Wells, & Whitley Counties. Source: AdvantAge Initiative Community Survey in Indiana 2008
Figure 25.5, Indiana-Area 3§ Number of years people age 60+ provide help to the frail or disabled among those who provide help* More than 3 years 42% Don’t know 6% ‡ <1 year 15% 1-3 years 37% ‡ Unweighted N=62 Weighted N=22,172 Note: Percentages may not add up to 100% due to rounding and/or missing information. *People who said they provide care were asked “In total, how long have you been caring for … ” ‡ This percentage is based on fewer than 20 respondents (Unweighted N<20) and should be interpreted with caution. § Area 3 includes Adams, Allen, De Kalb, Huntington, Lagrange, Noble, Steuben, Wells, & Whitley Counties. Source: AdvantAge Initiative Community Survey in Indiana 2008
Figure 25.6, Indiana-Area 3§ Number of hours per week spent on caregiving among people age 60+ who provide help to the frail or disabled* More than 10 hours 21% ‡ Don’t Know 12% 4-10 hours 24% ‡ ‡ 1-3 hours 43% Unweighted N=62 Weighted N=22,172 Note: Percentages may not add up to 100% due to rounding and/or missing information. *People who said they provide care were asked “On average how many hours per week are you caring for … ” ‡ This percentage is based on fewer than 20 respondents (Unweighted N<20) and should be interpreted with caution. § Area 3 includes Adams, Allen, De Kalb, Huntington, Lagrange, Noble, Steuben, Wells, & Whitley Counties. Source: AdvantAge Initiative Community Survey in Indiana 2008
Figure 26.1, Indiana-Area 3§ Percentage of people age 60+ who get respite/relief from their caregiving activity* No respite 34% Do not provide caregiving 79% Provide caregiving 21% Get respite 66% DK/RF <1% ‡ Unweighted N=300 Weighted N=106,028 Unweighted N=62 Weighted N=22,172 *People were asked whether they provide help or care, or arrange for help or care, for a relative or friend who is unable to do some things for him/herself due to illness or disability. *People were asked whether they get relief from their caregiving responsibilities. Note: Percentages may not add up to 100% due to rounding and/or missing information. ‡ This percentage is based on fewer than 20 respondents (Unweighted N<20) and should be interpreted with caution. § Area 3 includes Adams, Allen, De Kalb, Huntington, Lagrange, Noble, Steuben, Wells, & Whitley Counties. Source: AdvantAge Initiative Community Survey in Indiana 2008
Figure 26.2, Indiana-Area 3§ Percentage of people age 60+ who get respite/relief from their caregiving activity,* by demographics Base: People age 65+ who provide caregiving Total ‡ ‡ Age 60-64 ‡ ‡ Age 65-74 ‡ ‡ Age 75+ ‡ Women ‡ ‡ Men Unweighted N= 62 Weighted N= 22,172 Note: Percentages may not add up to 100% due to rounding and/or missing information. *People were asked whether they get relief from their caregiving responsibilities. ‡ This percentage is based on fewer than 20 respondents (Unweighted N<20) and should be interpreted with caution. § Area 3 includes Adams, Allen, De Kalb, Huntington, Lagrange, Noble, Steuben, Wells, & Whitley Counties. Source: AdvantAge Initiative Community Survey in Indiana 2008
Figure 26.3, Indiana-Area 3§ Percentage of people age 60+ who get respite/relief from their caregiving activity,* by demographics (cont’d) Base: People age 65+ who provide caregiving Total ‡ ‡ Education >HS ‡ Education <HS ‡ Ex/vg/good health ‡ ‡ Fair/poor health ‡ Live w/others ‡ ‡ Live alone Unweighted N= 62 Weighted N= 22,172 Note: Percentages may not add up to 100% due to rounding and/or missing information. ‡ This percentage is based on fewer than 20 respondents (Unweighted N<20) and should be interpreted with caution. § Area 3 includes Adams, Allen, De Kalb, Huntington, Lagrange, Noble, Steuben, Wells, & Whitley Counties. Source: AdvantAge Initiative Community Survey in Indiana 2008


![Independence and Safety with Affordable Home Care [Infographic]](https://cdn4.slideserve.com/7239623/slide1-dt.jpg)