Download
1 / 31
310 likes | 475 Views
Event Forewarning from Time-Series Analysis Future Soldier Conference London (14 April 2005) Lee M. Hively (presenter) Vladimir A. Protopopescu Oak Ridge National Laboratory (ORNL) * * Managed by UT-Battelle, LLC, for the USDOE under Contract No. DE-AC05-00OR22725.

E N D
Event Forewarning from Time-Series Analysis Future Soldier Conference London (14 April 2005) Lee M. Hively (presenter) Vladimir A. Protopopescu Oak Ridge National Laboratory (ORNL)* *Managed by UT-Battelle, LLC, for the USDOE under Contract No. DE-AC05-00OR22725
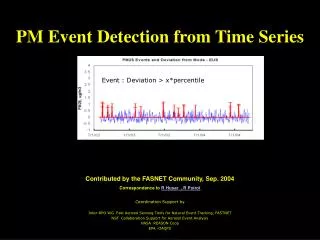
Problem: overview and aims • Key to reliability and survivability is … • Forewarning of adverse events … • Which arise from condition change … • That is hidden in noisy, complex data • Quantify change via practical technology: Fast – (near) real time Accurate – maximize total trues Portable – Ambulatory device
SOLUTION: quantify condition change Acquire Process-Indicative Data Remove Irrelevant Artifacts Capture Signature of Base Case Dynamics Capture Signature of Test Case Dissimilarity Between the Two Forewarning via Threshold Crossing
Data Quality Check • Proper number of data points? • Significant period(s) with no change? • Is sampling rate too low? • Monotonic increases or decreases? • Excessive quasi-periodicities? • Excessive noise? • Data correctly scaled? • Consistent signal amplitude?
Artifact Removal Time-serial data: xi Raw (EEG) data (3 s) Artifact (eyeblink) removal Artifact-filtered data
Phase-Space Reconstruction Construct phase space (PS): y(i) = [xi, xi+] in 2D y(i) = [xi, xi+, …, xi+(d-1)] Distribution function (DF) of PS points to capture invariant properties of the dynamics for comparison to sequel DFs
Multi-Channel Reconstruction • Data from channel A: ai • Data from channel B: bi • Data from channel C: ci • y(i) = [ai, ai+, …, ai+(d-1), bi, bi+, …, bi+(d-1), ci, ci+, …, ci+(d-1)]
Phase-Space Dissimilarity Measures • 2 = k (Pk – Qk)2/(Pk + Qk) • L = k |Pk – Qk| visitation frequency & location in PS • Dissimilarity measures: subtract, then integrate … moresensitive - Traditional measures: integrate, then subtract … less sensitive - Renormalization for consistency
Example 1: EEG data • Biomedical Monitoring Systems Inc. • Sample rate = 250 Hz • 19 channels of scalp data • Band-pass filtered: 0.5 - 99 Hz • Datasets span 5,000 – 29,500 seconds • 60 datasets: 40 event, 20 non-event • Multiple datasets: 30 from 11 patients • 36 females and 24 males: 4years57
Example 2: cardiac events • 5 electrocardiogram datasets • Digital data from Holter recordings • Analysis of one channel (250 Hz) • Datasets spanned <1 hour • Dissimilarity analysis for forewarning
Example 3: breathing difficulty • Test at Walter Reed Medical Ctr. - anesthetized pig - 0 to 1400 ml of air into pleural space - surface (chest) stethoscope - sampling rate = 10 kHz • Basecase for normal breathing (0 ml) • Testcases for 100 ml increments
Example 4: sepsis onset • 23 anesthetized rats at UTKMC - 17 exposed to inhaled endotoxin - 6 exposed to de-ionized water • 4 surface ECG electrodes (500 Hz) • Test protocol (1.5 to 3 hours total) - 30 to 60 minutes for baseline - 30 minutes of Salmonella endotoxin - 30 to 90 minutes of recovery
Example 5: fainting • Experiments at University of Ky • ECG (250 Hz ) • Flat (10m); 70° tilt (60m); flat (5m) • Two human subjects RAY/PSB (event), PSA (no event) RUI/PSB (event), PSA (no event)
Example 5: fainting results (3) • RAY event much larger slope (>12x) larger values (4x) • RUI event much larger slope (>1149x) much larger values (>34x)
Example 6: seeded motor fault Nominal = no fault 1st fault = rotor bar cut half way thru 2nd fault = same rotor bar cut 100% 3rd fault = second rotor bar cut 100% 4th fault = 2 more rotor bars cut 100% Motor power at 40kHz
Examples of Machine Failure Prognostication Data ProviderEquipment and Type of Failure Diagnostic Data 1) EPRI (S) 800-HP electric motor: air-gap offset motor power 2) EPRI (S) 800-HP electric motor: broken rotor motor power 3) EPRI (S) 500-HP electric motor: turn-to-turn short motor power 4) Otero/Spain (S) ¼-HP electric motor: imbalance acceleration 5) PSU/ARL (A) 30-HP motor: overloaded gearbox load torque 6) PSU/ARL (A) 30-HP motor: overloaded gearbox vibration power 7) PSU/ARL (A) 30-HP motor: overloaded gearbox vibration power 8) PSU/ARL (S) crack in rotating blade motor power 9) PSU/ARL (A) motor-driven bearing vibration power 10) EPRI (S) 800-HP electric motor: air-gap offset vibration power 11) EPRI (S) 800-HP electric motor: broken rotor vibration power 12) EPRI (S) 500-HP electric motor: turn-to-turn short vibration power 13) PSU/ARL (A) 30-HP motor: overloaded gearbox vibration power 14) PSU/ARL (A) 30-HP motor: overloaded gearbox vibration power 15) PSU/ARL (A) 30-HP motor: overloaded gearbox vibration power 16) PSU/ARL (A) 30-HP motor: overloaded gearbox vibration power 17) PSU/ARL (S) crack in rotating blade vibration power (S) = seeded fault (A) = accelerated failure
Technology status: Now at TRL 5 High-fidelity technology integration • Tests in simulated environment • Failure forewarning … • Via analysis of archival data … • On desktop computer … • 6 patents and two patents pending (US government retains patent rights)
Maturing from TRL5 to TRL7 • Analysis now on iPAQ3790… • With graphical user interface … • For on-line analysis of … • Real-time data … • Robust choice of parameters … • Yielding accurate predictions… • That are event- and duration-specific… • And analyst-independent TRL6 prototype
Encouraging Results … More R&D Needed • Desktop data analysis is faster than real-time • Present technology is approaching TRL6 • Good total-true forewarning rate • BUT … • Finding parameters is much slower than real-time And parameter determination is analyst-intensive • Present parameters are not sufficiently robust • Method is not specific … does not distinguish different event types
Conclusions: commercial prognostic • Data-driven, non-intrusive, fast • Provides robust, timely forewarning • Examples congruent with soldier use: - chest sounds - sepsis/ECG - epilepsy/EEG - fainting/ECG - motor failure
Conclusions: military prognostic • Data-driven, non-intrusive, fast • Provides robust, timely forewarning • Examples congruent with soldier use: - chest sounds abdominal wound - sepsis/ECG bio-warfare agent - epilepsy/EEG neurotoxin - fainting/ECG heat exhaustion - motor failure equipment failure
QUESTIONS • Contact Lee Hively (hivelylm@ornl.gov) Office: 865-574-7188 Fax: 865-576-5943 • http://computing.ornl.gov/cse_home/staff/hively.shtml