Download
1 / 47
500 likes | 771 Views
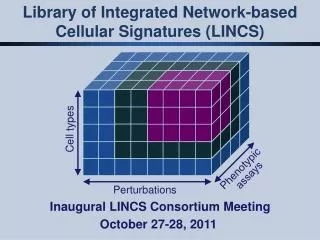
Library of Integrated Network-based Cellular Signatures (LINCS). September 20, 2013. LINCS concept. cell types. phenotypic assays. perturbations. perturbations scalable to genome high information content read-outs (e.g. gene expression) inexpensive mechanism to query database.

E N D
Library of Integrated Network-based Cellular Signatures (LINCS) September 20, 2013
LINCS concept cell types phenotypic assays perturbations • perturbations scalable to genome • high information content read-outs (e.g. gene expression) • inexpensive • mechanism to query database
Look-up table of cellular activity database COMMUNITY QUERIES PLATFORM- INDEPENDENT GENOME SCALE GENETIC PHARMACOLOGIC MODERATE COMPLEXITY 10’S COMPLEX read out perturbations cell types
The LINCS Network (NIH) Data Production/Analysis Centers Broad Institute Harvard Medical School Computational and Technology Development Centers Arizona State Broad Institute (Jake Jaffe) Columbia U. Cincinnati Miami School of Medicine Wake Forest Yale • External Collaborations • Snyder Lab, Sanford-Burnham Medical Research Institute • FDA • GTEx • ENCODE/Epigenomics • Rao Lab, NIH CRM: • Scadden Lab, Massachusetts General Hospital • McCray Lab, University of Iowa • Loring Lab, Scripps Research Institute • Edenberg Lab, Indiana University • Spria Lab, Boston University • Pandolfi Lab, BIDMC • Chen Lab, NHLBI • Kotton Lab, Boston University
Connectivity Map diseases genes drugs mRNA Expression Database 453 Affymetrix profiles 164 drugs > 16,000 users 916 citations Lamb et al, Science (2006)
CMAP/LINCS is an approach to functional annotation cell types perturbagens
CMap is limited by profiling cost • low-cost, high-throughput method would enable… primary screening libraries drug-like, non-drug-like, natural products genomic perturbagens shRNA, ORF, variants (natural + synthetic) cellular contexts tissues, types, culture conditions, genetics treatment parameters concentrations, durations, combinations • re-think: gene content × labeling × detection
observation: gene expression is correlated samples genes
Reduced Representation of Transcriptome reduced representation transcriptome ‘landmarks’ computational inference model genome-wide expression profile 80% ~ 100,000 profiles simulation % connections 1000 number of landmarks measured
Luminex Beads (500 colors, 2 genes/color) 001 1000-plex Luminex bead profiling 5' AAAA 3' RT 3' 5' 5'-PO4 | 3' TTTT ligation 5' 5' PCR hybridization Reagent cost: $5/sample
“L1000” expression profiling GeneChip L1000 measured inferred content technology throughput unit cost (reagent) 1 22,000 1 22,000 1,000 transcripts transcripts microarray 3× 96 / week $500 Luminex beads 200× 384 / week $5
Current LINCS Dataset small-molecules genomic perturbagens 1,209,824 profiles 1,000 landmark genes 21,000 inferred genes • 5,178 compounds • 1,300 off-patent FDA-approved drugs • 700 bioactive tool compounds • 2,000+ screening hits (MLPCN + others) • 3,712 genes (shRNA + cDNA) • targets/pathways of FDA-approved drugs (n=900) • candidate disease genes (n=600) • community nominations (n=500+) • 15 cell types • Banked primary cell types • Cancer cell lines • Primary hTERT-immortalized • Patient-derived iPS cells • 5 community nominated
findings • Large-scale gene-expression analysis • Analysis of L1000 shRNA signatures
Data quality: correlation between biological replicates
up-regulated down-regulated matching cell states 1) define a ‘query’ the set of genes up- and down- regulated in a cellular state of interest 2) assess strength of the query in the profile of all perturbagens in DB not connected connected cumulative score cumulative score genes (thousands) genes (thousands) 3) rank order perturbagens by connectivity strength rank perturbagen conn score drug Y drug e gene S … gene n drug I drug L … drug N gene E drug G 1 2 3 . . . . . 997 998 999 1 0.993 0.791 . 0 0 0 . -0.877 -0.945 -1 positive connectivity no connectivity negative connectivity
resistant sensitive sensitive resistant 1 perturbagen rank cell score 0.804 0.789 0.544 35-sirolimus 42-sirolimus 26-sirolimus 5 6 27 HL60 ssMCF7 MCF7 464 reversing drug resistance signature: glucocorticoid resistant acute lymphoblastic leukemia 50 ‘sensitive’ and 50 ‘resistant’ markers (David Twomey and Scott Armstrong) sirolimus hypothesis:sirolimus induces glucocorticoid sensitivity
The 1% challenge: the “tail” of current data is > ENTIRE previous dataset
query: histone deacetylase inhibitors (Glaser et al 2003) 0.5% Page 1 / 200
query: compound identified to induce the lysosomal apoptosis pathway (D’Arcy et al Nature Medicine 2012) 0.5% Page 1 / 200
query: HUVEC cells treated with pitavastatin (cell line not in panel) 0.5% Page 1 / 200
query: imatinib-resistant chronic myeloid leukemia (Frank et al Leukemia 2006) 0.5% Page 1 / 200
findings • Large-scale gene-expression analysis • Analysis of L1000 shRNA signatures
LINCS as a starting point for functional follow-up biological goal • Connections b/w genes and drugs • GWAS gene lists to pathways • Causal mutation to therapeutic leads • Discovering new cancer pathways • MoA of novel small-molecules • Biological novelty biasing
Core Signature DB Core Gene signatures from KD (n=1387) Genes (n=1387) 263 Components explain 80% of the variance Similarity Metric 22268 Features Genes (n=1387) Signature Diversity • Mining the Similarity Matrix • Unsupervised • Global Patterns • Supervised • Gene->[Gene,Pathway,Compound]
Global Views of Connections Most connected genes Connections per gene 49% of genes have at least 1 connection > 0.4 PC3 cell line
querying LINCS for connections • JAK2 knockdown connects to STAT1 signature • FOS knockdown connects to JUN signature • Cell cycle genes connected (CCND1, CDK2, CDK4, CDK6, CCNE1, E2F1) • ERknockdown connected to ER antagonists & inversely connected to ER agonists • JAK2 over-expression signature inversely to JAK2 inhibitor (lestaurtinib) • HDAC knock-downs connected to HDAC inhibitors (vorinostat, others) • NRF2 over-expression signature inversely connected to curcumin • WNT1 gene connections: TCF7L1, GSK3B, CSNK2A2, PRAKACA, SMAD3 • …
Integrating queries across members of a pathway AKT1 • genes connections AKT3, FOXO1, PDPK1, PHLPP1, PIK3CB • Top 10 small-molecule connections
allele classification S. Jacobs & D. Altshuler • genes implicated by GWAS • can be many hundreds, most unannotated • create profiles of ablation (shRNA) in suitable cells by L1000 • universal functional bioassay • cluster into “complementation groups” • assign genes to groups, groups to pathways, pathways to disease 39 genes associated with T2D
Target ID Drug signature in MCF7 All MCF7 CGS Query Molecular target of Drug A wtcsscore rank Dissimilar Similar
An Example where integrating across many shRNAs improves Connections Each dot is a dose / timepointof rapamycin MTOR shRNA 1 MTOR shRNA 2 MTOR shRNA 3 MTOR shRNA 4 MTOR shRNA 5 MTOR shRNA 6 MTOR shRNA 7 MTOR shRNA 8 MTOR shRNA 9 MTOR shRNA 10 MTOR shRNA 11 MTOR shRNA 12 MTOR shRNA 13 MTOR Consensus Gene Signature 1 1000 2000 3000 4000 5000 Connectivity Rank of Small Molecules
Query with Vemerafinib, highlight BRAF shRNAs Each dot is an individual shRNA targeting BRAF Cell line Negative Correlation Positive Correlation Rank of shRNA (%)
BEZ235: a dual ATP-competitive PI3K and mTOR inhibitor Dose dependent connectivity
Current list of significant drug-CGS connectivities span multiple MoA’s
Goal: Given a chemical library: • identify the bioactive subset of a library • identify unique bioactivity Gene-expression as a universal measure of bioactivity If we see no robust gene expression consequence whatsoever across a diverse panel of cell types, then it's likely that the compound has no bioactivity.
L1000 as a sensor of bioactivity S-C plot signature strength (S) signature robustness across replicates (C) dose titration active analogs (high S-C) inactive analogs (low S-C)
biological novelty biasing of chemical libraries • global bioactivity detection using L1000 profiles • number and magnitude of expression changes, and robustness • calibrate with 350 known bioactives across 47 cell lines • median sensitivity of individual cell lines is 42% (90% specificity) • rationally-designed panel of 7 cell lines achieves 95% sensitivity • qualification, de-duplication, and novelty biasing • consolidate and subset libraries based on function 20 chemical libraryn = 9,875 signal strength activen = 487 (5%) 6 known MoAn = 435 (4.5%) noveln = 52 (0.5%) 0 -1 0 1 reproducibility de-duplicatedn = 30 (0.3%)
Broad LINCS U54 • Data Generation: 1.2M+ profiles released to LINCS • Data Access: Multiple levels of data matrices, cloud-compute beta released • Biologist-friendly web user interfaces • Emerging scientific findings • Causal mutation to therapeutic leads • GWAS gene lists to pathways • Discovering new cancer pathways • Connecting small-molecules to biology • Biological novelty biasing of chemical libraries
CMap Analytical Rajiv Narayan Joshua Gould Corey Flynn Ted Natoli David Wadden Ian Smith Roger Hu Larson Hogstrom Peyton Greenside CMap Data Generation David Peck John Davis Roger Cornell Xiaohua Wu Xiaodong Lu Melanie Donahue Todd Golub Broad Scientists Jesse Boehm Bang Wong Federica Piccioni John Doench David Root Suzanne Jacobs Paul Clemons Stuart Schreiber Aly Shamji Broad Platforms RNAi platform Chemical Biology TD/TS