Download
1 / 42
420 likes | 494 Views
Wytham Woods: A Carbon Cycle Perspective. Yadvinder Malhi, Nathalie Butt, Mike Morecroft, Katie Fenn. 2000-2009 (PgC). 10. 5. Source. deforestation. CO 2 flux (PgC y -1 ). 1.1±0.7. 5. Sink. 10. 1950. 2000. 1900. 1850. Time (y). Human Perturbation of the Global Carbon Budget.

E N D
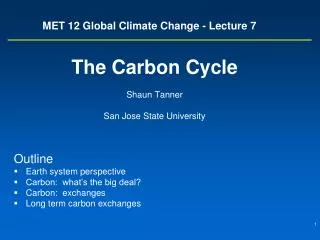
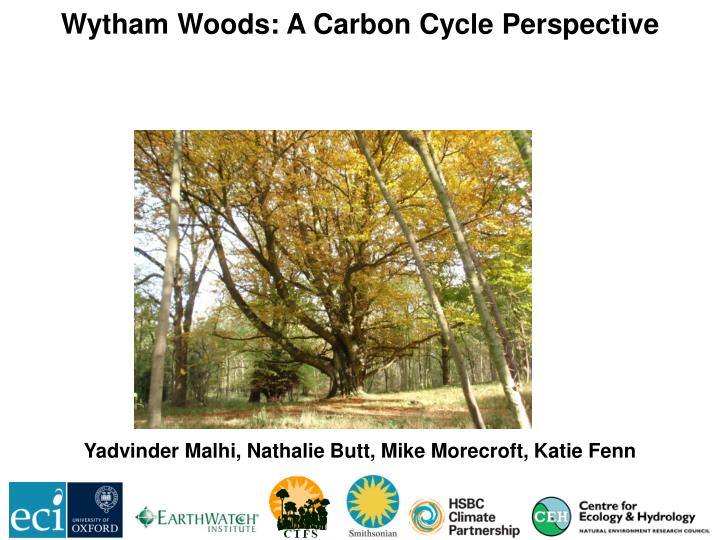
Wytham Woods: A Carbon Cycle Perspective Yadvinder Malhi, Nathalie Butt, Mike Morecroft, Katie Fenn
2000-2009 (PgC) 10 5 Source deforestation CO2 flux(PgC y-1) 1.1±0.7 5 Sink 10 1950 2000 1900 1850 Time (y) Human Perturbation of the Global Carbon Budget Global Carbon Project 2010; Updated from Le Quéré et al. 2009, Nature Geoscience; Canadell et al. 2007, PNAS
2000-2009 (PgC) 10 fossil fuel emissions 7.7±0.5 5 Source deforestation CO2 flux(PgC y-1) 1.1±0.7 5 Sink 10 1950 2000 1900 1850 Time (y) Human Perturbation of the Global Carbon Budget Global Carbon Project 2010; Updated from Le Quéré et al. 2009, Nature Geoscience; Canadell et al. 2007, PNAS
2000-2009 (PgC) 10 fossil fuel emissions 7.7±0.5 5 Source deforestation CO2 flux(PgC y-1) 1.1±0.7 5 Sink 10 1950 2000 1900 1850 Human Perturbation of the Global Carbon Budget Time (y) Global Carbon Project 2010; Updated from Le Quéré et al. 2009, Nature Geoscience; Canadell et al. 2007, PNAS
2000-2009 (PgC) 10 fossil fuel emissions 7.7±0.5 5 Source deforestation CO2 flux(PgC y-1) 1.1±0.7 atmospheric CO2 4.1±0.1 5 Sink 10 1950 2000 1900 1850 Time (y) Human Perturbation of the Global Carbon Budget Global Carbon Project 2010; Updated from Le Quéré et al. 2009, Nature Geoscience; Canadell et al. 2007, PNAS
2000-2009 (PgC) 10 fossil fuel emissions 7.7±0.5 5 Source deforestation CO2 flux(PgC y-1) 1.1±0.7 atmospheric CO2 4.1±0.1 5 Sink ocean 2.3±0.4 ocean (5 models) 10 1950 2000 1900 1850 Time (y) Human Perturbation of the Global Carbon Budget Global Carbon Project 2010; Updated from Le Quéré et al. 2009, Nature Geoscience; Canadell et al. 2007, PNAS
2000-2009 (PgC) 10 fossil fuel emissions 7.7±0.5 5 Source deforestation CO2 flux(PgC y-1) 1.1±0.7 atmospheric CO2 4.1±0.1 land 5 2.4 (Residual) Sink ocean 2.3±0.4 (5 models) 10 1950 2000 1900 1850 Time (y) Human Perturbation of the Global Carbon Budget Global Carbon Project 2010; Updated from Le Quéré et al. 2009, Nature Geoscience; Canadell et al. 2007, PNAS
So there is a large carbon sink in the land biosphere Where is it? What does it mean for climate change? What is causing it? Why is it so unstable? Will it persist?
Woodland in the Upper Thames Basin T. Riutta, unpublished
Network of small plots, 0.3 - 1ha Flux tower Canopy walkway Smithsonian 18 ha plot
The CTFS, Smithsonian Institute, the world’s largest tropical forest programme. • First census plot set up in Panama in 1980 • Global network monitoring 4.5 million individual tropical trees; 8,500 species • Long term, large scale research • Collaboration with 75 institutions – 42 plots, 21 countries Extension into non-tropical systems as The Smithsonian Institution Global Earth Observatories (SIGEO)
The census • Laying out plots & subplots (450 subplots) • Tagging • Identifying • Measuring • Marking • Mapping • Recording • …of every stem >1cm dbh • More than 20, 000 stems!
N All stems mapped across the whole plot 300 m
Example of annual CO2 cycle Dry summer smaller CO2 sink Warm autumn bigger CO2 source source sink Aurela et al. 2007, Tellus B
The Breath of Wytham Woods 2010 2009 2008 Thomas et al. 2010 Biogeosciences
The carbon balance of Wytham Woods What is causing this carbon sink? How long will it persist?
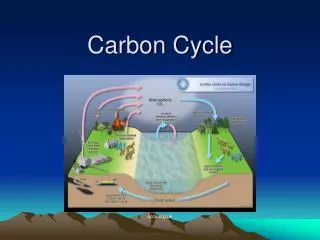
GPP The Carbon Cycle of a Forest NPP VOC NPPleaves,flowers,fruit R leaf NPPwood (Branch + Stem) DFine litterfall R stem R soil R CWD DCWD R roots NPPcoarse roots NPPfine roots DRoot R soil het Fdoc
Stem and leaf respiration Weather station Growth Soil respiration Litterfall trap Soil core Ingrowth Cores Rhizotron
The carbon cycle of Wytham Woods Fenn et al., in review
Earthwatch fragmented woodland objectives To quantify how the woodland carbon cycle varies • Between forest core areas and edges and between large and small fragments • In current and changing climatic conditions >60% of the forest area in this region can be classified as edge Forest edges and small fragments are more sensitive to changes in weather conditions, especially moisture-related Climate change impacts are larger in these habitats
Water loss at forest edge Trees near the forest edge use more water and have a different microclimate Herbst et al. 2007. Forest Ecology and Management 250.
Watering experiment • Watering once a week from the beginning of June until the beginning of September. • The amount of water added corresponds to 200 mm extra rainfall.
Litter decomposition experiment • Two mesh sizes: large mesh allows soil macrofauna access to the leaves, small mesh excludes them. • Three months of decomposition, from the beginning of June to the beginning of September.
Soil macrofauna • Approximately 80% of the leaf litter in a woodland is consumed by the soil fauna • In Britain, woodlice and millipedes • Initial breakdown of leaf litter, mixing into a homogeneous state • The presence of soil macrofauna enhances microbial decomposition • Soil fauna is sensitive to temperature and moisture conditions
Results Ash Oak Error bars ±1 SE
Thank you! Katie Fenn, Martha Crockatt, Michele Taylor, Nigel Fisher, Toby Marthews, Terhi Riutta, Paul Eddowes, Kate Barker, Sara Banning, Emma Bush, Kate Grounds, Ben Cjiffers, Richard Sylvester, Sam Armenta Butt, Luke Sherlock, Youshey Zakiuddin, Dan Gurdak, Arthur Downing, Dominic Jones, Jay Varney, Leo Armenta Butt, Jeremy Palmer, HSBC volunteers.