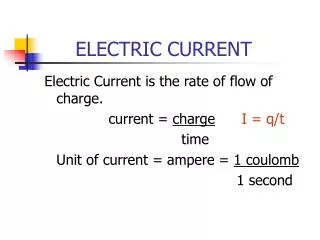
Download
1 / 1
10 likes | 125 Views
Self-Organized Criticality. Figure 1: Sandpile Model. Max. Min. Summary. Figure 2: Sandpile Extremes. Instability in a Diffusion Model. A. B. References. Magnetic field (blue lines). Self Organization in a Diffusion Model of Thin Electric Current Sheets. S. S. D=D min.

E N D
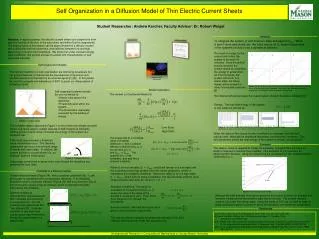
Self-Organized Criticality Figure 1: Sandpile Model Max Min Summary Figure 2: Sandpile Extremes Instability in a Diffusion Model A B References Magnetic field (blue lines) Self Organization in a Diffusion Model of Thin Electric Current Sheets S S D=Dmin Student Researcher: Andrew Kercher, Faculty Advisor: Dr. Robert Weigel Abstract: In space plasmas, thin electric current sheets are observed to form near the surface of the sun, in the solar wind, and within Earth’s magnetotail. The basic physics of this system can be approximated by a diffusion model with a diffusivity that has hysteresis, and switches between low and high, depending on local current amplitude. We show that under constant energy input conditions, this system evolves to a state with characteristics of self-organized criticality. Analysis S S D=Dmax D=Dmax D=Dmin The input of energy by the source term drives the system to the point of criticality. Once the critical point is reached, the system reacts by unloading the energy in avalanches . As time increases, the system will return to a stable state, but steep slopes will be present in many local spatial positions [3]. The field and definition of self-organization are still being developed, but our general features of interest are the development of dynamics and structure that are not imposed by an external agent ([1],[2]). In this poster we use the concepts and metaphors of SOC to guide our interpretation of modeling results. Figure 5(A -F): Shows the progression of the system at specific times. The source forces critical gradient to be exceeded. The result is the unloading of energy in avalanches, which balance and overcome the energy input. Model Description • Self-organized systemsinclude, but are not limited to: • Simple rules govern the dynamics. • Thresholds exist within the system. • The threshold is eventually exceeded by the buildup of energy. The revised Lu Continuum Model [4] This internal turbulence keeps the overall system close to but below criticality [3]. Energy: The total field energy of the system at any instant is defined as C D A B The sandpile system depicted in Figure 1 is one of the most simple and well-known examples used to explain features of Self-Organized Criticality. Adding grains of sand slowly increases the energy of the system at a constant rate. When the value of the source function coefficient is increased, the field self-adjusts itself. Although the amplitude decreases, the frequency increases. This self-adjustment allows the total energy of the system to remain unchanged [3]. If the local slope exceeds a threshold value, avalanches occur. The resulting avalanches can occur over a broad range of length and time scales. In addition, the system evolves to a point where it is, on average, near the critical point. Long range correlations in space exist, even though the dynamics are governed by local rules. A linear diffusion model (Figure 3A), with a constant coefficient (Eq. 1), will be brought to equilibrium with a proportional diffusivity. If an instability threshold exists in nonlinear diffusion (Figure 3B) with a source term (Eq. 2), the nonlinearity causes irregular diffusion which is subject to the limits imposed by the instability. Figure 7: Time averaged field strength Systems displaying characteristics associated with SOC dissipate stored energy in avalanches [3]. It is this instability that determines this “fast diffusion”[3]. Once the instability is reached, local slopes cause rapid movement, driving the system back to a stable state. Although the field strength is being increased by the source function, on average this increase in balanced by the dynamic state that is induced. The system remains close to, but under the critical state. Using the ideas of SOC we are able to begin to draw conclusions about a system in which the dynamics are extremely complicated. Source Function: We treat the source as a given function and set it specifically. [1] Per Bak, Chao Tang, Kurt Wiesenfeld. Phys. Rev. Lett. Vol. 59 (1987) 381 [2] Henrik Heldtoft Jensen, Kim Christensen and Hans C. Fogedby, Phys. Rev.B, Vol. 40 (1989) 7425 [3] A. Klimas et al. Self-organized substorm phenomenon and its relation to localized reconnection in the magnetospheric plasma sheet, J. Geophys. Res., 105(A8), (2000) 18,765-18,780. [4] E. T. Lu. Avalanches in continuum driven dissipative systems, Phys. Rev. Lett., 74(13), (1995) 2511-2514. This has the effect of steadily increasing the strength of the field reversal and the current sheet that supports it [3]. Undergraduate Research in Computational Mathematics at George Mason University Figure 3: A) Linear with source B) Nonlinear with source A B C 5.50 5.50 5.00 Critical 5.00 4.50 4.50 4.00 4.00 3.50 3.50 3.00 3.00 2.50 2.50 2.00 0 5 10 15 20 25 30 t 0 5 10 15 20 25 30 2.00 t D E F 6.50 6.00 5.50 6.00 5.00 Average 4.50 5.50 4.00 5.00 3.50 3.00 4.50 -L 2.50 4.00 2.00 2.00 3.50 0 5 10 15 20 25 30 0 5 10 15 20 25 30 t t -L 0 L Z