Comprehensive Project Management Strategy and Evaluation for IT Enhancements
This report outlines the detailed project management strategy adopted for various IT projects, including the upgrading of client databases, CRM systems, and cash management processes. It covers project initiation, planning, development, and ongoing operations, alongside communication and governance frameworks. The evaluation is based on feedback from respondents using questionnaires to gauge success levels in achieving defined objectives. The findings offer critical insights for improving project delivery and align stakeholder expectations with operational capabilities.

Comprehensive Project Management Strategy and Evaluation for IT Enhancements
E N D
Presentation Transcript
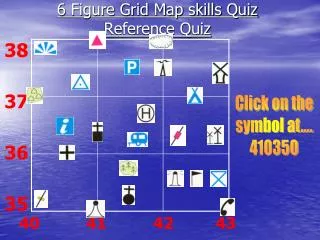
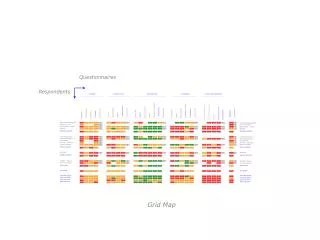
Questionnaires Project start Initiation Project planning Control Evaluation & reporting 3. Development Achieved level Respondents WHO IT projects 1. Strategy 2. Requirements 3. Development 4. Acceptance 5. Day-to-day operattions Coordination Proces Documentation Infrastructure & tools 4. Acceptance Achieved level Objectives Communication Governance 1. Strategy Achieved level Proces Documentation Quality 2. Requirements Achieved level Grandtotal Achieved level Client database upgrade New Crm system Social media – phase 1 Training Marketing projects Client database upgrade New Crm system Social media – phase 1 Training Marketing projects Cash Management - 1 Cash Management - 2 Consolidation Phoenix – 3rd phase System upgrade Finance projects Cash Management - 1 Cash Management - 2 Consolidation Phoenix – 3rd phase System upgrade Finance projects RFID pilot Logistics projects RFID pilot Logistics projects SAP/HR – Phase 2 File restructuring HR projects SAP/HR – Phase 2 File restructuring HR projects Grandtotal Grandtotal Less than €100k. Less than €500k. Less than €1m. More than €1m. Less than €100k. Less than €500k. Less than €1m. More than €1m. Grid Map
Maturity level Groups of respondents Questionnaires Manhattan Map
Most DISagreeing respondent Two respondents DISagree Gliding scale of agreement % support for m’ment objective Two respondents AGREE M’ment objective Most AGREEing respondent Dendrogram
80% 60% 40% Follow the leader Go Go GO !!! 1 1 Questionnaire 1. Questionnaire 2. Questionnaire 3. 3 2 Agreement with the management objective 3 2 Few small steps Confrontation or compromise 40% 60% 80% Agreement within the team Change Management Quadrant
Respondentssorted from least to most behind target Questions sorted from least to most behind target Gap Map
Scores Actual situation (bottom-up) Bottom-up planned improvement Top-down desired (management) Comparing Top-down vs. Bottom-up Waste (planned BUT not desired) Right (planned AND desired) Shortage (not planned BUT desired) Waste Map
Potential Everyone shares with everyone else Reality Apply filter to divide the workload Respondent 1 Respondent 2 Respondent 3 Respondent 4 Respondent 5 Respondent 6 Respondent 7 Respondent 8 Respondent 9 Respondent 10 Respondent 11 Respondent 12 Respondent 1 Respondent 2 Respondent 3 Respondent 4 Respondent 5 Respondent 6 Respondent 7 Respondent 8 Respondent 9 Respondent 10 Respondent 11 Respondent 12 Respondent 1 Respondent 2 Respondent 3 Respondent 4 Respondent 5 Respondent 6 Respondent 7 Respondent 8 Respondent 9 Respondent 10 Respondent 11 Respondent 12 Respondent #.7 kan help respondent #.6 with a lot of issues Buddy Map