Download

1 / 22
220 likes | 450 Views
Motivation for Conjoint Analysis and Formulating Attribute Lists Copyright Sawtooth Software, Inc. Different Perspectives, Different Goals. Buyers want all of the most desirable features at lowest possible price

E N D
Motivation for Conjoint Analysis and Formulating Attribute Lists Copyright Sawtooth Software, Inc.
Different Perspectives, Different Goals • Buyers want all of the most desirable features at lowest possible price • Sellers want to maximize profits by:1) minimizing costs of providing features 2) providing products that offer greater overall value than the competition
Demand Side of Equation • Typical market research role is to focus first on demand side of the equation • After figuring out what buyers want, next assess whether it can be built/provided in a cost- effective manner
Products/Services are Composed of Features/Attributes • Credit Card:Brand + Interest Rate + Annual Fee + Credit Limit • On-Line Brokerage:Brand + Fee + Speed of Transaction + Reliability of Transaction + Research/Charting Options
Breaking the Problem Down • If we learn how buyers value the components of a product, we are in a better position to design those that improve profitability
How to Learn What Customers Want? • Ask Direct Questions about preference: • What brand do you prefer? • What Interest Rate would you like? • What Annual Fee would you like? • What Credit Limit would you like? • Answers often trivial and unenlightening (e.g. respondents prefer low fees to high fees, higher credit limits to low credit limits)
How to Learn What Is Important? • Ask Direct Questions about importances • How important is it that you get the <<brand, interest rate, annual fee, credit limit>> that you want?
Stated Importances • Importance Ratings often have low discrimination:
Stated Importances • Answers often have low discrimination, with most answers falling in “very important” categories • Answers sometimes useful for segmenting market, but still not as actionable as could be
Self-Explicated, Multi-Attribute Models • Self-explicated models use a combination of the “Which brands do you prefer?” and “How important is brand?” questions • For each attribute (brand, price, performance, etc.) respondents rate or rank the levels within that attribute • Respondents rate an overall importance for the attribute, when considering the various levels involved • Preference scores (utilities) can be developed by combining the preferences for levels with the importance of the attribute overall
Self-Explicated Models (continued) • Self-explicated models can be used to study many attributes and levels in a questionnaire • Some researchers refer to self-explicated models as “self-explicated conjoint,” but this is a misnomer as no conjoint tradeoffs are involved • In certain cases, self-explicated models perform as well as conjoint analysis • Most researchers favor conjoint analysis or discrete choice modeling, when the project allows
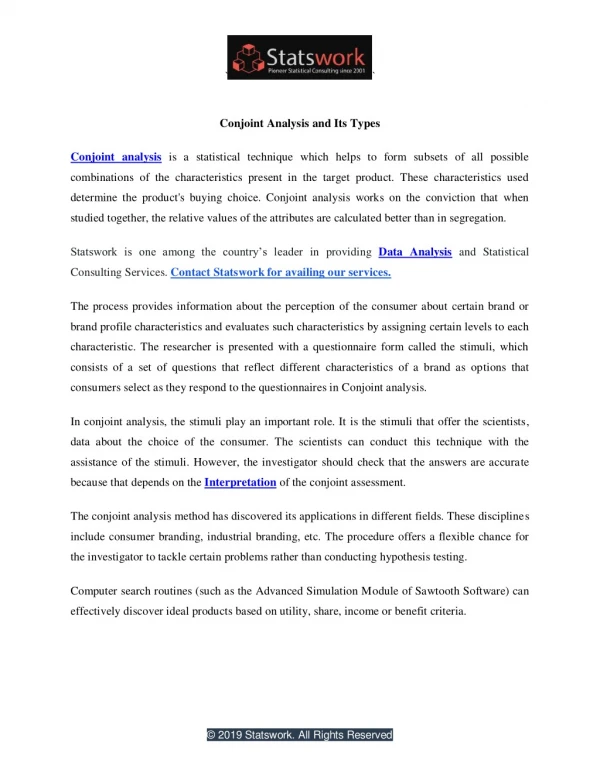
What is Conjoint Analysis? • Research technique developed in early 70s • Measures how buyers value components of a product/service bundle • Dictionary definition-- “Conjoint: Joined together, combined.” • Marketer’s catch-phrase-- “Features CONsidered JOINTly”
Important Early Articles • Luce, Duncan and John Tukey (1964), “Simultaneous Conjoint Measurement: A New Type of Fundamental Measurement,” Journal of Mathematical Psychology, 1, 1-27 • Green, Paul and Vithala Rao (1971), “Conjoint Measurement for Quantifying Judgmental Data,” Journal of Marketing Research, 8 (Aug), 355-363 • Johnson, Richard (1974), “Trade-off Analysis of Consumer Values,” Journal of Marketing Research, 11 (May), 121-127 • Green, Paul and V. Srinivasan (1978), “Conjoint Analysis in Marketing: New Development with Implications for Research and Practice,” Journal of Marketing, 54 (Oct), 3-19 • Louviere, Jordan and George Woodworth (1983), “Design and Analysis of Simulated Consumer Choice or Allocation Experiments,” Journal of Marketing Research, 20 (Nov), 350-367
How Does Conjoint Analysis Work? • We vary the product features (independent variables) to build many (usually 12 or more) product concepts • We ask respondents to rate/rank those product concepts (dependent variable) • Based on the respondents’ evaluations of the product concepts, we figure out how much unique value (utility) each of the features added • (Regress dependent variable on independent variables; betas equal part worth utilities.)
What’s So Good about Conjoint? • More realistic questions:Would you prefer . . .210 Horsepower or 140 Horsepower17 MPG 28 MPG • If choose left, you prefer Power. If choose right, you prefer Fuel Economy • Rather than ask directly whether you prefer Power over Fuel Economy, we present realistic tradeoff scenarios and infer preferences from your product choices
What’s So Good about Conjoint? (cont) • When respondents are forced to make difficult tradeoffs, we learn what they truly value
First Step: Create Attribute List • Attributes assumed to be independent (Brand, Speed, Color, Price, etc.) • Each attribute has varying degrees, or “levels” • Brand: Coke, Pepsi, Sprite • Speed: 5 pages per minute, 10 pages per minute • Color: Red, Blue, Green, Black • Each level is assumed to be mutually exclusive of the others (a product has one and only one level level of that attribute)
Rules for Formulating Attribute Levels • Levels are assumed to be mutually exclusiveAttribute: Add-on featureslevel 1: Sunrooflevel 2: GPS Systemlevel 3: Video Screen • If define levels in this way, you cannot determine the value of providing two or three of these features at the same time
Rules for Formulating Attribute Levels • Levels should have concrete/unambiguous meaning“Very expensive” vs. “Costs $575”“Weight: 5 to 7 kilos” vs. “Weight 6 kilos” • One description leaves meaning up to individual interpretation, while the other does not
Rules for Formulating Attribute Levels • Don’t include too many levels for any one attribute • The usual number is about 3 to 5 levels per attribute • The temptation (for example) is to include many, many levels of price, so we can estimate people’s preferences for each • But, you spread your precious observations across more parameters to be estimated, resulting in noisier (less precise) measurement of ALL price levels • Better approach usually is to interpolate between fewer more precisely measured levels for “not asked about” prices
Rules for Formulating Attribute Levels • Whenever possible, try to balance the number of levels across attributes • There is a well-known bias in conjoint analysis called the “Number of Levels Effect” • Holding all else constant, attributes defined on more levels than others will be biased upwards in importance • For example, price defined as ($10, $12, $14, $16, $18, $20) will receive higher relative importance than when defined as ($10, $15, $20) even though the same range was measured • The Number of Levels effect holds for quantitative (e.g. price, speed) and categorical (e.g. brand, color) attributes
Rules for Formulating Attribute Levels • Make sure levels from your attributes can combine freely with one another without resulting in utterly impossible combinations (very unlikely combinations OK) • Resist temptation to make attribute prohibitions (prohibiting levels from one attribute from occurring with levels from other attributes)! • Respondents can imagine many possibilities (and evaluate them consistently) that the study commissioner doesn’t plan to/can’t offer. By avoiding prohibitions, we usually improve the estimates of the combinations that we will actually focus on. • But, for advanced analysts, some prohibitions are OK, and even helpful


![Preference Elicitation [Conjoint Analysis]](https://cdn2.slideserve.com/5322185/preference-elicitation-conjoint-analysis-dt.jpg)