Conjoint Analysis
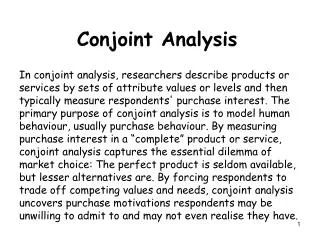
What is Conjoint Analysis?. Conjoint analysis is a versatile marketing research technique that can provide valuable information.Which new products will be successful? Which features or attributes of a product or service drive the purchase decision? Do specific market segments exist for a product


Conjoint Analysis
E N D
Presentation Transcript
3. What is Conjoint Analysis? Conjoint analysis is a versatile marketing research technique that can provide valuable information.
Which new products will be successful?
Which features or attributes of a product or service drive the purchase decision?
Do specific market segments exist for a product?
What advertising appeals will be most successful with these segments?
Will changes in product design increase consumer preference and sales?
What is the optimal price to charge consumers for a product or service?
Can price be increased without a significant loss in sales?
4. Conjoint analysis made its first appearance in �60s by R. Luce and J. Tukey.
Conjoint analysis made its first appearance in marketing research in 1971 by P. Green and V. Rao.
We reflect on the activities that characterize research in conjoint analysis, two keys trends appear to have been the development of :
(1) standard microcomputer packages.
(2) modified approaches to conjoint analysis for obtaining stable part-worth estimates at the individual level for problems involving large numbers of attributes.
The survey points out there are 956 research cases using conjoint analysis from 560 marketing research institutes in Europe by Wittink(1994).
5. The Basics of Conjoint Analysis Suppose you wanted to book an airline travel and you had a choice of spending $400 or $700 for a ticket.
The lower priced ($400) ticket is preferable.
What if the only consideration in booking a travel was sitting in a regular or extra-wide seat?
You would probably prefer an extra-wide seat.
Finally, suppose you can take either a direct travel which takes three hours or a travel that stops once and takes five hours.
Virtually everyone would prefer the direct travel.
6. In a real purchase situation, however, consumers do not make choices based on a single attribute.
Conjoint analysis examines these trade- offs to determine the combination of attributes that will be most satisfying to the consumer.
By using conjoint analysis a company can determine the optimal features for their product or service.
Conjoint analysis will identify the best advertising message by identifying the features that are most important in product choice.
7. A Practical Example of Conjoint Analysis Q: Would you prefer an airline travel with A or B?
A: regular seats, that costs $400 and takes 5 hours.
B: costs $700 has extra-wide seats and takes 3 hours.
Extending this, we see that if seat comfort, price and duration are the only relevant attributes, there are potentially eight travel choices.
8. Given the above alternatives:
Product 4 is very likely the most preferred choice.
Product 5 is probably the least preferred product.
The preference for the other choices is determined by what is important to that individual.
Conjoint analysis can be used to determine:
Relative importance of each attribute, attribute level, and combinations of attributes.
If the most preferable product is not feasible for some reason, identify the next most preferred alternative.
Using other information, such as background demographics be able to identify market segments for which distinct products may be appealing.
9. Utility Value A traveler may like the comfort and arrival time of a particular travel, but reject purchase due to the cost.
In this case, price has a high utility value.
Utility can be defined as a number which represents the value that consumers place on an attribute.
Utility represents the relative "worth" of the attribute.
10. This consumer places a greater value on a 3 hour travel (the utility is 42) than on a 5 hour travel (utility is 22).
This consumer does not differ much in the value that he or she places on comfort. That is, the utilities are quite close (12 vs. 15).
This consumer places a much higher value on a price of $400 than a price of $700.
Average utilities can be calculated for all consumers or for specific subgroups of consumers.
11. Back to the question above:
Would you prefer an airline travel with regular seats, that costs $400 and takes 5 hours, or a travel which costs $700 has extra-wide seats and takes 3 hours?
For the consumer:
12. The importance of an attribute:
Calculated by examining the range of utilities (that is, the difference between the lowest and highest utilities) across all levels of the attribute.
Duration: Range=20 (42-22)
Comfot: Range= 3 (15-12)
Cost: Range=56 (61- 5)
Attribute relative importance weights:
13. Choice Simulations Choice simulations reveal consumer preference for specific products defined by the researcher.
The researcher defined three airline travels as follows:
Travel 1: $300, 5 hours, two stops, meal
Travel 2: $400, 4 hours, one stops, snack
Travel 3: $500, 3 hours, direct , no meal
The conjoint simulation will :
Indicate the percentage of consumers that prefer each of the three travels.
Show that consumers are willing to travel longer if they can pay less and are provided a meal.
Allow the researcher to estimate preference, sales and share for new travels before they come to market.
In this case, simulations will identify successful and unsuccessful travel packages before they are introduced to the market!
14. Data Collection The data can be conveniently collected in locations such as shopping centers or by the Internet.
Data collection involves showing respondents a series of cards that contain a written description of the product or service.
Respondents can make the sort of those cards or give each of them a score.
If a consumer product is being tested then a picture of the product can be included along with a written description.
15. A typical card examining the business traveller might look like the following:
17. Data Collection in ACA
18. Case Study---Breakfast Cereal The demonstration conjoint analysis study of cereal is the outcome of a lecture on market modelling.
The attributes and levels for the study were:
19. The design comprised 16 cards as shown .
In practice, these are on separate cards and respondents rank them.
Respondents rated each of the 16 products on a 0 to 100 scale, where 0 is "no chance I would buy" and 100 is "definitely buy�.
20. The chart below shows the relative influence on preference - and the strength of brands.
21. The first scenarios shows brand strength when all else is equal.
22. Survey Flow
23. Schedule
24. Something to Remind The client often has a detailed understanding of the product category, and previous work has usually identified many issues of interest.
The respondent, on the other hand, usually has less interest and enthusiasm, and is rarely willing to submit to a long interview.
The expedients:
Limit the number of attributes to what the client may regard as unrealistically few.
Limit the number of levels per attribute.
Estimate values for groups rather than individuals. If the analysis is done by aggregating data for many individuals, each person may have to answer only a few questions.
25. Conclusion Marketers can use the information from utility values to design products and/or services which come closest to satisfying important consumer segments.
Conjoint analysis will identify the relative contributions of each feature to the choice process.
This technique, therefore, can be used to identify market opportunities by exploring the potential of product feature combinations that are not currently available.


![Preference Elicitation [Conjoint Analysis]](https://cdn2.slideserve.com/5322185/preference-elicitation-conjoint-analysis-dt.jpg)