Download
1 / 17
170 likes | 274 Views
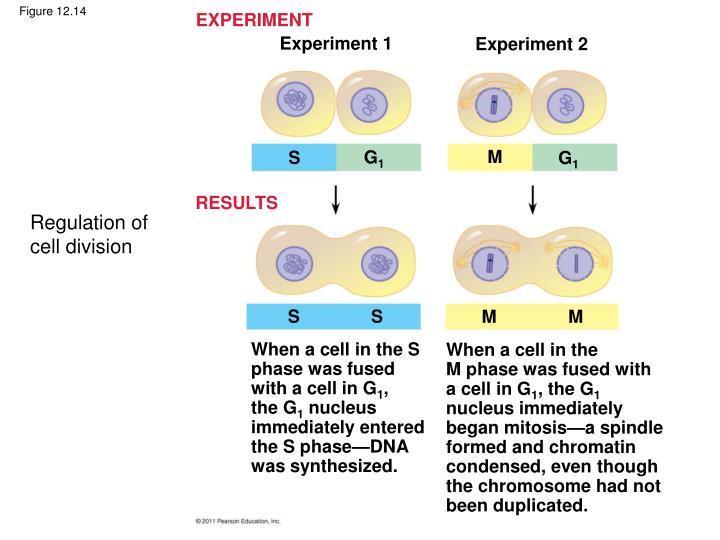
EXPERIMENT. Experiment 1. Experiment 2. M. G 1. S. G 1. Figure 12.14. RESULTS. Regulation of cell division. S. S. M. M. When a cell in the S phase was fused with a cell in G 1 , the G 1 nucleus immediately entered the S phase—DNA was synthesized.

E N D
EXPERIMENT Experiment 1 Experiment 2 M G1 S G1 Figure 12.14 RESULTS Regulation of cell division S S M M When a cell in the Sphase was fusedwith a cell in G1,the G1 nucleusimmediately enteredthe S phase—DNAwas synthesized. When a cell in the M phase was fused witha cell in G1, the G1nucleus immediatelybegan mitosis—a spindleformed and chromatincondensed, even thoughthe chromosome had notbeen duplicated.
G1 checkpoint Figure 12.15 Controlsystem S G1 G2 M M checkpoint G2 checkpoint
G0 G1 checkpoint Figure 12.16 G1 G1 (a) Cell receives a go-ahead signal. (b) Cell does not receive a go-ahead signal.
M M G1 G2 G1 G2 M S G1 S MPF activity Figure 12.17a Cyclinconcentration Time (a) Fluctuation of MPF activity and cyclin concentration during the cell cycle
Figure 12.17b G1 S Cdk Cyclin accumulation M G2 Degradedcyclin G2checkpoint Cdk Cyclin isdegraded Cyclin MPF (b) Molecular mechanisms that help regulate the cell cycle
Scalpels 1 A sample of humanconnective tissue iscut up into smallpieces. Experimental set-up for cell growth Petridish Figure 12.18 2 Enzymes digestthe extracellularmatrix, resulting ina suspension offree fibroblasts. 10 m 4 PDGF is addedto half thevessels. 3 Cells are transferred toculture vessels. With PDGF Without PDGF
Cancer tissue lacks growth inhibition (or may have internal over-stimulation (Ras mutations) Anchorage dependence Figure 12.19 Density-dependent inhibition Density-dependent inhibition 20 m 20 m (b) Cancer cells (a) Normal mammalian cells
1 5 4 3 2 MUTATION Growthfactor Hyperactive Ras protein(product of oncogene)issues signals on itsown. Ras G protein GTP Ras P P GTP P P Figure 18.24a P P Protein kinases(phosphorylation cascade) Receptor NUCLEUS Transcriptionfactor (activator) DNA Gene expression Protein that stimulatesthe cell cycle (a) Cell cycle–stimulating pathway
2 1 3 Protein kinases MUTATION Defective or missingtranscription factor,such asp53, cannotactivatetranscription. Figure 18.24b Activeformof p53 UVlight DNA damagein genome DNA Protein thatinhibitsthe cell cycle (b) Cell cycle–inhibiting pathway
EFFECTS OF MUTATIONS Figure 18.24c Proteinoverexpressed Protein absent Cell cycleoverstimulated Increased celldivision Cell cycle notinhibited (c) Effects of mutations
1 2 4 3 5 A multistep model for the development of colorectal cancer. Colon Figure 18.25 Lossof tumor-suppressorgene APC(or other) Lossof tumor-suppressorgene p53 Activationof rasoncogene Additionalmutations Lossof tumor-suppressorgene DCC Colon wall Small benigngrowth(polyp) Largerbenign growth(adenoma) Normal colonepithelial cells Malignanttumor(carcinoma)
The growth and metastasis of a malignant breast tumor. Lymph vessel Figure 12.20 Tumor Bloodvessel Cancercell Glandulartissue Metastatictumor A tumor growsfrom a singlecancer cell. Cancer cells invade neighboringtissue. Cancer cells spreadthrough lymph andblood vessels to other parts of the body. Cancer cells may survive and establisha new tumor in another part of the body. 1 2 3 4
Stem Cell Division Asymmetric Inheritance of Mother Versus Daughter Centrosome Science 26 January 2007:Vol. 315. no. 5811, pp. 469 - 470DOI: 10.1126/science.1138237
Asymmetric segregation is produced by centrosomes Fig. 1. GFP-labeled daughter centrosomes migrate away from the niche. Stereotyped positioning of centrosomes in male germline stem-cells during interphase sets up the orientation of the mitotic spindle [adapted from (6)]. Red, centrosome; blue, hub; green, tubulin. Drosophila male germline stem cells (GSCs) are maintained through attachment to somatic hub cells, which constitute the stem cell niche. Hub cells secrete the signaling ligand Upd, which activates the Janus kinase–signal transducer and activator of transcription (JAK-STAT) pathway in the neighboring germ cells to specify stem cell identity (4, 5). Drosophila male GSCs normally divide asymmetrically, producing one stem cell, which remains attached to the hub, and one gonialblast, which initiates differentiation. This stereotyped asymmetric outcome is controlled by the orientation of the mitotic spindle in GSCs: The spindle lies perpendicular to the hub so that one daughter cell inherits the attachment to the hub, whereas the other is displaced away (6).
Centrosome positions are controlled by cell junctions Fig. 3. Centrosomes next to the hub harbor robust microtubule arrays. Electron micrograph and summary diagram of a proximal centrosome in a GSC. Arrowheads in (A') show a microtubule that runs from the centrosome to the adherens junction. Science 26 January 2007:Vol. 315. no. 5811, pp. 469 - 470DOI: 10.1126/science.1138237
Centrosomin is a protein that controls centrosome segregation Fig. 4.Mutant for centrosomin (cnn) ; cnn is required for nonrandom segregation of mother and daughter centrosomes. Centrosomin (cnn) is an integral centrosomal protein required to anchor astral microtubules to centrosomes Science 26 January 2007:Vol. 315. no. 5811, pp. 469 - 470DOI: 10.1126/science.1138237
Hub cells control stem cell renewal and differentiation Model for JAK pathway activity in embryogenesis. Upd is the ligand for stimulation of the JAK pathway. Upd protein is produced in hub cells, in which it is glycosylated and secreted, and diffusion is restricted by association with the ECM. Through binding of Upd to a yet unidentified receptor, the Hop JAK is stimulated, resulting in phosphorylation of Stat92E. Ultimately, transcription of specific genes, such as eve, is activated. D. A. Harrison, P. E. McCoon, R. Binari, M. Gilman, N. Perrimon, Genes Dev.12, 3252 (1998)