Exploring Brain Growth in Autism: Longitudinal Study from Ages 2 to 4 Years
10 likes | 90 Views
This study presents preliminary results on longitudinal changes in brain growth between ages 2 and 4 years in children with autism compared to typical development. The findings reveal striking cerebral asymmetry and brain torque, with differences in cortical gray matter growth patterns. Group analyses show notable differences in cerebellum development between the autism and control groups. The research methodology demonstrates potential for investigating longitudinal changes and group differences in brain development trajectories. Future studies will explore gender differences and confirm these initial findings with larger samples.

Exploring Brain Growth in Autism: Longitudinal Study from Ages 2 to 4 Years
E N D
Presentation Transcript
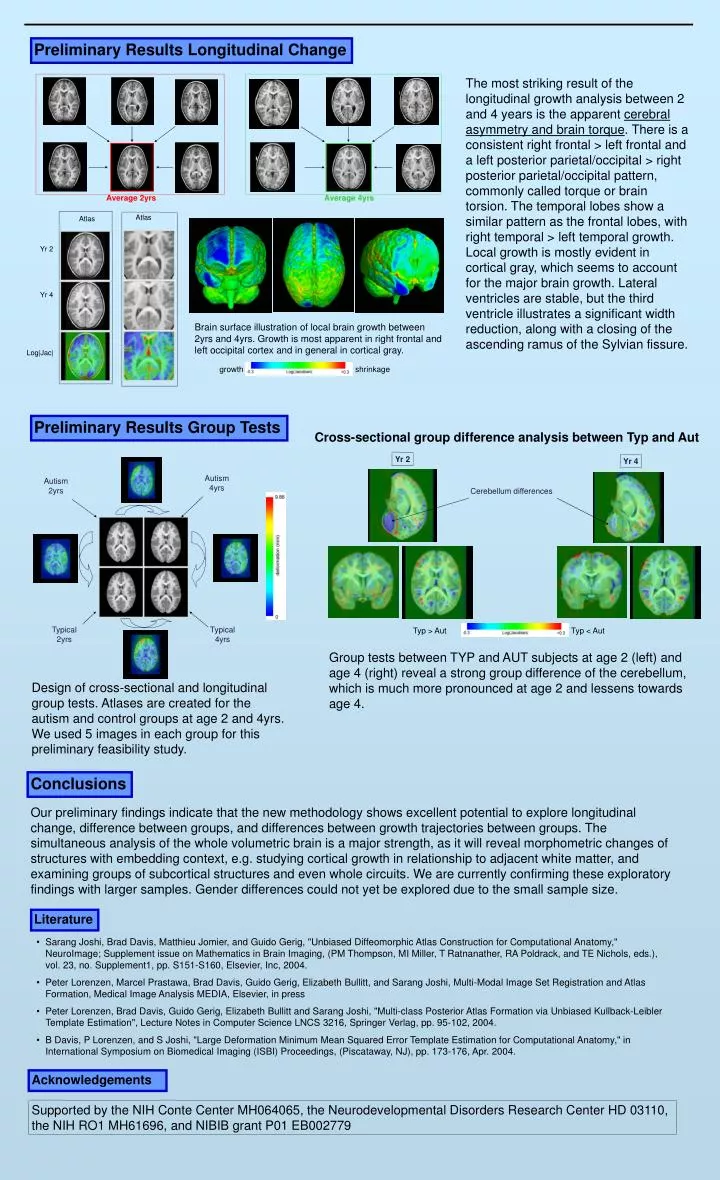
Atlas Atlas Yr 2 Yr 4 Average 2yrs Average 4yrs Log|Jac| Autism 4yrs Autism 2yrs Yr 2 Yr 4 Cerebellum differences Typical 2yrs Typical 4yrs Preliminary Results Longitudinal Change The most striking result of the longitudinal growth analysis between 2 and 4 years is the apparent cerebral asymmetry and brain torque. There is a consistent right frontal > left frontal and a left posterior parietal/occipital > right posterior parietal/occipital pattern, commonly called torque or brain torsion. The temporal lobes show a similar pattern as the frontal lobes, with right temporal > left temporal growth. Local growth is mostly evident in cortical gray, which seems to account for the major brain growth. Lateral ventricles are stable, but the third ventricle illustrates a significant width reduction, along with a closing of the ascending ramus of the Sylvian fissure. Brain surface illustration of local brain growth between 2yrs and 4yrs. Growth is most apparent in right frontal and left occipital cortex and in general in cortical gray. growth shrinkage Preliminary Results Group Tests Cross-sectional group difference analysis between Typ and Aut Typ > Aut Typ < Aut Group tests between TYP and AUT subjects at age 2 (left) and age 4 (right) reveal a strong group difference of the cerebellum, which is much more pronounced at age 2 and lessens towards age 4. Design of cross-sectional and longitudinal group tests. Atlases are created for the autism and control groups at age 2 and 4yrs. We used 5 images in each group for this preliminary feasibility study. Conclusions Our preliminary findings indicate that the new methodology shows excellent potential to explore longitudinal change, difference between groups, and differences between growth trajectories between groups. The simultaneous analysis of the whole volumetric brain is a major strength, as it will reveal morphometric changes of structures with embedding context, e.g. studying cortical growth in relationship to adjacent white matter, and examining groups of subcortical structures and even whole circuits. We are currently confirming these exploratory findings with larger samples. Gender differences could not yet be explored due to the small sample size. Literature • Sarang Joshi, Brad Davis, Matthieu Jomier, and Guido Gerig, "Unbiased Diffeomorphic Atlas Construction for Computational Anatomy," NeuroImage; Supplement issue on Mathematics in Brain Imaging, (PM Thompson, MI Miller, T Ratnanather, RA Poldrack, and TE Nichols, eds.), vol. 23, no. Supplement1, pp. S151-S160, Elsevier, Inc, 2004. • Peter Lorenzen, Marcel Prastawa, Brad Davis, Guido Gerig, Elizabeth Bullitt, and Sarang Joshi, Multi-Modal Image Set Registration and Atlas Formation, Medical Image Analysis MEDIA, Elsevier, in press • Peter Lorenzen, Brad Davis, Guido Gerig, Elizabeth Bullitt and Sarang Joshi, "Multi-class Posterior Atlas Formation via Unbiased Kullback-Leibler Template Estimation", Lecture Notes in Computer Science LNCS 3216, Springer Verlag, pp. 95-102, 2004. • B Davis, P Lorenzen, and S Joshi, "Large Deformation Minimum Mean Squared Error Template Estimation for Computational Anatomy," in International Symposium on Biomedical Imaging (ISBI) Proceedings, (Piscataway, NJ), pp. 173-176, Apr. 2004. Acknowledgements Supported by the NIH Conte Center MH064065, the Neurodevelopmental Disorders Research Center HD 03110, the NIH RO1 MH61696, and NIBIB grant P01 EB002779