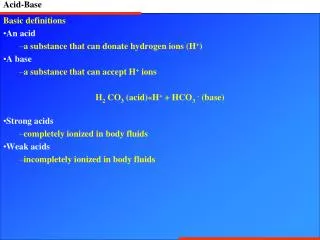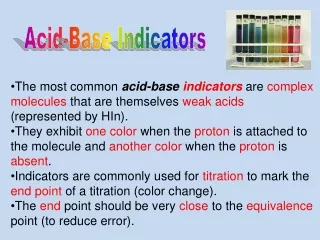
ACID-BASE INDICATORS
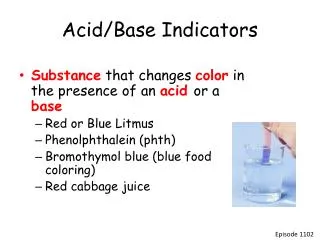
ACID-BASE INDICATORS. An acid-base indicator is a weak acid or a weak base. Examples of indictors used in acid base reactions Litmus Phenolphthalein Methyl orange

ACID-BASE INDICATORS
E N D
Presentation Transcript
ACID-BASE INDICATORS An acid-base indicator is a weak acid or a weak base. Examples of indictors used in acid base reactions Litmus Phenolphthalein Methyl orange thymol blue, tropeolin OO, methyl yellow, methyl orange, bromphenol blue, bromcresol green, methyl red, bromthymol blue, phenol red, neutral red, phenolphthalein, thymolphthalein, alizarin yellow, tropeolin O, nitramine, and trinitrobenzoic acid.
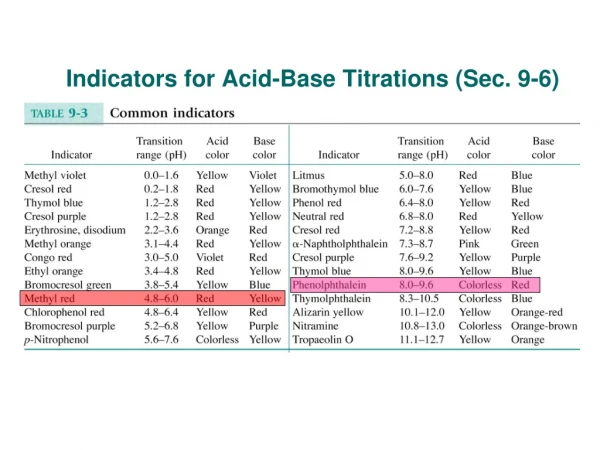
The pH range of indictors Indictors dose not change colour sharply at one particular pH, they change over a narrow range of pH
Litmus • Indicators as weak acids Litmus • Litmus is a weak acid. It has a seriously complicated molecule which we will simplify to HLit. The "H" is the proton which can be given away to something else. The "Lit" is the rest of the weak acid molecule. The ionised litmus is blue The un-ionised litmus is red
What happened when • Adding hydrogen ions
If the concentrations of HLit and Lit - are equal: • At some point during the movement of the position of equilibrium, the concentrations of the two colours will become equal. The colour you see will be a mixture of the two. blue red brown
Phenolphthalein • is a chemical compound with the formulaC20H14O4 (often written as "HIn" or "phph"). Often used in titrations, it turns colorless in acidic solutions and pink in basic solutions Collarless acidic
The importance of pKind • Think of what happened through the color change.at this point the concentration of the acid and its ion are equal • pH=pkind • This means that the end point for the indictor depends entiry on what pKind value is
Methyl orange What is methyl orange? How is it made? Methyl orange is an intensely colored compound used in dyeing and printing textiles. It is also known as C.I. Acid Orange 52, C.I. 13025, helianthine B, Orange III, Gold orange, and Tropaeolin D. Chemists use methyl orange as an indicator in the titration of weak bases with strong acids. It changes from red (at pH 3.1) to orange-yellow (at pH 4.4): pH-related color changes result from changes in the way electrons are confined in a molecule when hydrogen ions are attached or detached. Methyl orange in acidic solution. Methyl orange in basic solution. Methyl orange in acidic solution.
Titration curves for strong base with strong acid Both of ph.ph and M.O. are useful
Titration curves for strong acid v weak base • This time we are going to use hydrochloric acid as the strong acid and ammonia solution as the weak base. MO is useful and ph.ph is useless
Titration of weak base with strong acid M.O is useful phph is useless
Choosing indictor for titration Titration of weak base with strong acid Both phph and M.O are useful
Titration curves for weak base v strong acid Ph.phis useful M.O is useless
Titration curves for weak base with week acid Both phph and MO are useless
Titration of sodium carbonate with HCl Phph useful for detect first endpoint MO is useful for detect the second end point
A summary of the important curves The way you normally carry out a titration involves adding the acid to the alkali. Here are reduced versions of the graphs described above so that you can see them all together