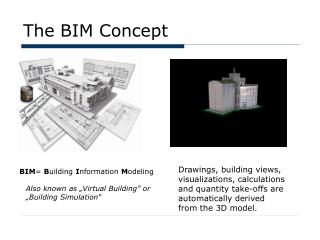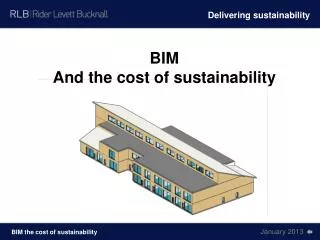
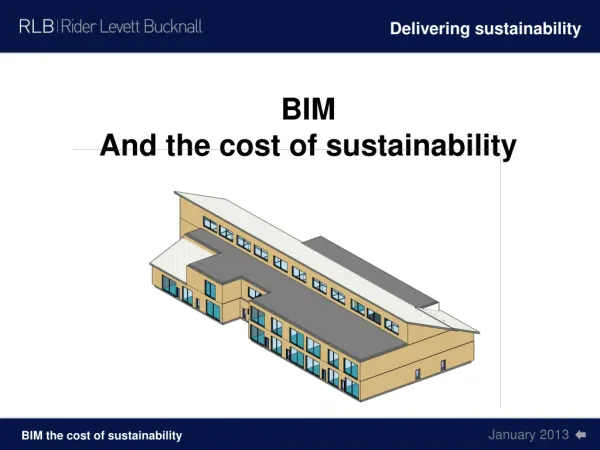
BIM And the cost of sustainability
Delivering sustainability. BIM And the cost of sustainability. Introduction. This is a case study of a PassivHaus primary school that has been collaboratively designed, built and operated. For a modest capital investment PassivHaus generates very low: P ower consumption kW

BIM And the cost of sustainability
E N D
Presentation Transcript
Delivering sustainability BIM And the cost of sustainability
Introduction • This is a case study of a PassivHaus primary school that has been collaboratively designed, built and operated. • For a modest capital investment PassivHaus generates very low: • Power consumption kW • Utility bills (revenue costs) £ • Carbon emissions CO2 • The tools required include: • Collaboration • Benchmarking • Life cycle cost • Building Information Modelling • Facilities management
Collaboration • Collaboration Structural Architect MEP QS PM Sub contractor Main contractor Client FM
BIM Collaboration • Information is added to the same model as the design progresses. • The coordinator can merge the separate files by converting to IFC “common” file format • The Design & Build contractor can add supply chain information • The client owns the completed BIM and amends with refurbishment and adaption TEKLA Structural ArchiCad Architecture Bentley Systems MEP Data enrichment Quantity extraction Specialist sub contractor Main contractor Client FM
Benchmarking • Benchmarking
Benchmark: Capital • The Cabinet Office has published benchmarks Secondary school of 8-10,000 m² is average £ 2,158/m² This school (Primary) 2,400m² £ 2,077/m² “More for less” “Good is good enough” 20% savings in capital cost
Benchmark: power, revenue and carbon • CIBSE has produced benchmarks for power consumption and carbon emissions. • Schools and seasonal public buildings • Previous school F 260 kW/m² • Average D 190 kW/m² • Target B 120 kW/m² (less than half) Utility cost per annum £11,000 (previous £27,000) • Carbon emissions 73 tCO2(previous 190)
Replacement Life cycle cost • Life cycle cost Capital Maintenance Operation
Framework “J” curve • With a framework the supply chain can afford to invest, gain experience and improve. 20 15 10 5 0 -5 -10 -15
Cost benefit analysis • Capital cost • Project 1 2% (+) £108,000 • Project 2 1%(+) £54,000 • Project 3 0% (+) £0 • Revenue savings • power consumption (-) 120 kW/m²pa 70-190 • Utility bills (-) £16,000 11-27k • Carbon emissions (-) 105 tCO2 75-180t • Payback 8,4,0 years
Building Information Models • What is a Building Information Model? A 3D drawing plus information All the data for a project is stored in one file The data is dynamically inter related • The information we need to add includes: Capital cost, time programmes, life cycle costs, capital allowances, embodied carbon, carbon in use and Facilities Management 3D +i
3D, 4D and 5D 3D A Architecture S Structural ME Mechanical Electrical and Plumbing 4D W +TIME planning and construction simulation 5D Q +COST (Capital, life cycle & FM)
Benefits • All information in one file Co-ordinated collaboration • VisualisationHigh level reporting to management • Clash detection Solving problems before site • Building performance Daylight, heat loss, reverberation • Standard component library Create a standard specificationLean constructioneconomies of scale • Standard format for data Reuse and transfer of information • Client operational data Refurbishment / adaption / space planning
“Family” information Click on “Family” for Information including length, area and volume.
“Family” additional parameters • +QS, PM, BS and FM data • Capital rates • Life cycle cost (anticipated life expectancy) • Carbon reduction • Capital allowances • Programming and phasing • Building reinstatement cost • Health & safety • Client accountancy coding • Asset registers • Trade package coding • Risk management • Facility management planning • Material scheduling
“Family” design options and level of detail “Level of detail” Alternative> Doors: Timber, metal, glass etc. Boiler: Biomass, Gas, CHP. 1 Concept 2 Schematic 3 Technical
Revit plus Cost, time and carbon Designers Revit file (*.rvt) Architect Structure M&E Revit Program QS & PM Supply chain Family files (*.RFA) Application Programming Interface (API) SQL Database
RLBIM: import RLB database RLBIM External database (NRM description library). OUTSIDE of Revit but accessible from within Revit. The “primary key” is the same assembly code as used within Revit
Capital cost plan in Revit And Elemental Breakdown
RIBA plan of works: COBie drops Structural Architecture MEP Owner QS Contractor 3D Design 1 2 3 4 5 COBie
Conclusion • Conclusion
Summary • Delivering sustainability from start to finish in a cost-effective way • A holistic approach to capital and revenue • Collaboration • Building Information Modelling • Life cycle cost planning • Benefits: • Economies of scale and standardisation -£ • Lower power consumption -kW • Lower utility bills (revenue costs) -£pa • Lower Carbon emissions -CO2 “More for less” “Good is good enough” 20% savings in capital cost
Delivering sustainability Brendan.Patchell@uk.rlb.com RLB.com