1.1 Functions
180 likes | 196 Views
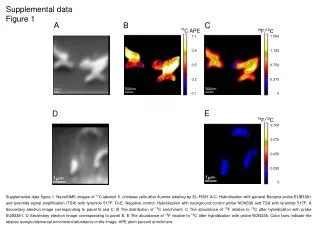
Learn about functions and the Cartesian coordinate system, including graphing equations, making tables of ordered pairs, and understanding function notation.

1.1 Functions
E N D
Presentation Transcript
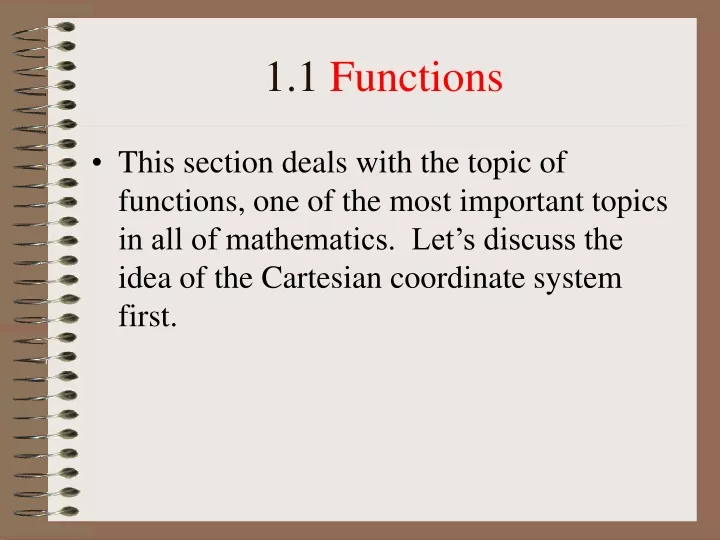
1.1 Functions • This section deals with the topic of functions, one of the most important topics in all of mathematics. Let’s discuss the idea of the Cartesian coordinate system first.
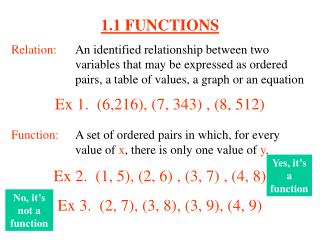
Cartesian Coordinate System • The Cartesian coordinate system was named after Rene Descartes. It consists of two real number lines which meet at a point called the origin. The two number lines which meet at a right angle divide the plane into four areas called quadrants. • The quadrants are numbered using Roman numerals as shown. Each point in the plane corresponds to one and only one ordered pair of numbers (x , y). Two ordered pairs are shown.
I II (3,1) x (-1,-1) III IV y
Graphing an equation • To graph an equation in x and y, we need to find ordered pairs that solve the equation and plot the ordered pairs on a grid. For example, let’s plot the graph of the equation y = x2 + 2
Making a table of ordered pairs • Let’s make a table of ordered pairs that satisfy the equation y = x2 + 2
Plotting the points • Next, plot the points and connect them with a smooth curve. You may need to plot additional points to see the pattern formed.
Function • The previous graph is the graph of a function. The idea of a function is this: a relationship between two sets D and R • such that for each element of the first set, D, there corresponds one and only one element of the second set, R. For example, the cost of a pizza (C) is related to the size of the pizza. A 10 inch diameter pizza costs 9.00 while a 16 inch diameter pizza costs 12.00.
Function definition • You can visualize a function by the following diagram which shows a correspondence between two sets, D, the domain of the function and R, the range of the function. The domain gives the diameter of pizzas and the range gives the cost of the pizza. range domain 10 9.00 12 16 10.00 12.00
Functions specified by equations • Consider the previous equation that was graphed Inputx = -2 -2 Process: square (–2) then subtract 2 (-2,2) is an ordered pair of the function. Output: result is 2 2
Function Notation • The following notation is used to describe functions The variable y will now be called • This is read as “ f of x” and simply means the y coordinate of the function corresponding to a given x value. Our previous equation can now be expressed as
Functionevaluation • Consider our function • What does mean? Replace x with the value –3 and evaluate the expression • The result is 11 . This means that the point (-3,11) is on the graph of the function.
Some Examples • 1.
Domain of a Function • Consider • which is not a real number. Question: for what values of x is the function defined?
Domain of a function • Answer: • is defined only when the radicand (3x-2) • is greater than or equal to zero. This implies that 3x-2 0 or
Domain of a function • Therefore, the domain of our function is the set of real numbers that are greater than or equal to • Examples. Find the domain of the following functions. • Answer:
More examples • Find the domain of • In this case, the function is defined for all values of x except where the denominator of the fraction is zero. This means all real numbers x except
Mathematical modeling • The price-demand function for a company is given by • where P(x) represents the price of the item and x represents the number of items. Determine the revenue function and find the revenue generated if 50 items are sold.
Solution • Revenue = price x quantity so • R(x)= p(x)*x = • When 50 items are sold, x = 50 so we will evaluate the revenue function at x = 50 • The domain of the function has already been specified. We are told that