Download
1 / 1
10 likes | 124 Views
ASSESSING SEARCH TERM STRENGTH IN SPOKEN TERM DETECTION Amir Harati and Joseph Picone Institute for Signal and Information Processing, Temple University. www.isip.piconepress.com. Introduction Searching audio, unlike text data , is approximate and is based on likelihoods.

E N D
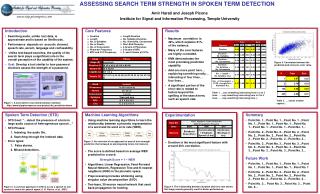
ASSESSING SEARCH TERM STRENGTH IN SPOKEN TERM DETECTIONAmir Harati and Joseph Picone Institute for Signal and Information Processing, Temple University www.isip.piconepress.com • Introduction • Searching audio, unlike text data, is approximate and is based on likelihoods. • Performance depends on acoustic channel, speech rate, accent, language and confusability. • Unlike text-based searches, the quality of the search term plays a significant role in the overall perception of the usability of the system. • Goal: Develop a tool similar to how password checkers assess the strength of a password. Core Features • Results • Maximum correlation is46%, which explains 21% of the variance. • Many of the core featuresare highly correlated. • KNN demonstrates themost promising predictioncapabilty. • Add one more point here…explaining something really…interesting in four lines…four lines… • A significant portion of theerror rate is related to factors beyond thespelling of the search term, such as speech rate. Figure 4. Correlation between the predicted and reference error rates. Table 1. …say something interesting here in 2 to 3 lines… …say something interesting here in 2 to 3 lines… …say something interesting here i… Table 2. … needs a better caption… Figure 1. A screenshot of our demonstration software: http://www.isip.piconepress.com/projects/ks_prediction/demo • Spoken Term Detection (STD) • STD Goal: “…detect the presence of a term in large audio corpus of heterogeneous speech…” • STD Phases: • Indexing the audio file. • Searching through the indexed data. • Error types: • False alarms. • Missed detections. • Machine Learning Algorithms • Using machine learning algorithms to learn the relationship between a phonetic representation of a word and its word error rate (WER). • The score is defined based on average WER predicted for a word: • Strength Score = 1 − WER • Algorithms: Linear Regression, Feed-Forward Neural Network, Regression Tree and K-nearest neighbors (KNN) in the phonetic space. • Preprocessing includes whitening using singular value decomposition (SVD). • Two-layer, 30-neuron neural network that used back-propagation for training. • Summary • Point No. 1…Point No. 1…Point No. 1…Point No. 1…Point No. 1…Point No. 1…Point No. 1…Point No. 1…Point No. 1…Point No. 1… • Point No. 2…Point No. 2…Point No. 2…Point No. 2…Point No. 2…Point No. 2…Point No. 2…Point No. 2…Point No. 2…Point No. 2… • Point No. 3…Point No. 3…Point No. 3…Point No. 3…Point No. 3…Point No. 3…Point No. 3…Point No. 3…Point No. 3…Point No. 3… • Future Work • Point No. 1…Point No. 1…Point No. 1…Point No. 1…Point No. 1…Point No. 1…Point No. 1 • Point No. 2…Point No. 2…Point No. 2…Point No. 2…Point No. 2…Point No. 2…Point No. 2…Point No. 2…Point No. 2…Point No. 2… • Point No. 3… Point No. 3…Point No. 3… Point No. 3… • Experimentation • Duration is the most significant feature with around 40% correlation. Figure 3. An overview of our approach to search term strength prediction that is based on decomposing terms into features. Figure 4. The relationship between duration and error rate shows that longer words generally result in better performance. Figure 2. A common approach in STD is to use a speech to text system to index the speech signal (J. G. Fiscus, et al., 2007).