Download
1 / 3
0 likes | 9 Views
Growth in Biotechnology and Pharmaceutical Sectors: Increased research and development in these sectors drives demand for accurate and high-throughput cell counting solutions.<br>Rising Prevalence of Chronic Diseases: As cancer and other chronic illnesses increase globally, so does the demand for cell-based research and therapies, fueling the market for cell counting technologies.<br>Technological Advancements: Innovations in imaging, AI-driven analysis, and microfluidics have led to more sophisticated and accessible automated cell counting devices, expanding their use across varied applications.

E N D
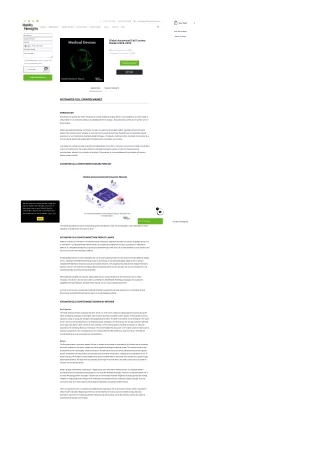
+1 217 636 3356 +44 20 3289 9440 sales@mobilityforesights.com Your Cart 0 Company Market Reports Consumer Research Advisory Services Exports - Imports Careers Contact Us Blog Your cart is empty Your Name Return to Shop Business Email Global Automated Cell Counter Market 2024-2030 Country Phone Number +82 Company Name Single User License : $ 3,500 Your message Corporate User License : $ 6,000 By submitting this form, you are agreeing to the Request Sample Terms of Use and Privacy Policy. I'm not a robot reCAPTCHA Privacy - Terms BUY NOW DOWNLOAD SAMPLE DESCRIPTION TABLE OF CONTENTS AUTOMATED CELL COUNTER MARKET INTRODUCTION Automated cell counters are used in medical and research facilities to analyze blood or urine samples to count the variety of cells present or to evaluate the viability of a cultivated cell line for analysis. Automated cell counters can be used for urine or blood analysis. Modern automated hematology instruments can either use optical methods (light scatter), impedance-based techniques based on the Coulter principle (changes in electrical current caused by blood cells flowing through an electrically charged opening), or a mix of optical and impedance-based techniques. Compared to hemocytometers, automated cell counters have more advanced systems that enable better throughput and more accurate cell counting. Automated cell counters are made to quickly and independently count cells. In many labs, manual cell counting is the de facto method for counting cells. The results obtained by manually counting the number of cells with trypan blue and a hemocytometer, however, have a number of problems. These causes of error are addressed by automated cell counting utilising image cytometry. AUTOMATED CELL COUNTER MARKET SIZE AND FORECAST We use cookies to understand site usage and improve content and offerings on our site. To learn more, refer to our Privacy Policy. By continuing to use this site, or closing this box, 0 Learn more you consent to our use of cookies. Got it! Send message Continue Shopping The Global automated cell counter market accounted for $XX Billion in 2023 and is anticipated to reach $XX Billion by 2030, registering a CAGR of XX% from 2024 to 2030. AUTOMATED CELL COUNTER MARKET NEW PRODUCT LAUNCH DeNovix Launches 21 CFR Part 11 Compliance Ready Software for CellDrop Automated Cell Counter. EasyApps Secure is a 21 CFR Part 11 Compliance Ready software solution for CellDrop Automated Cell Counters, according to a release from DeNovix Inc. Regulated laboratories can generate compliant findings within their cell counting workflow securely thanks to the new set of controls for the EasyApps software. Since EasyApps Secure is entirely integrated into the on-board operating system, the lab doesn’t need any additional laptops or PCs. CellDrop’s DirectPipette Technology makes it unnecessary to use disposable plastic slides for cell counting in regulated GxP facilities in the pharmaceutical and biotech industries. The programme has features like integrated electronic signature controls, safe audit trail recording, password-protected system access, thorough user account management, and sophisticated data processing and export facilities. With CellDrop Automated Cell Counters, plastic slides that are costly and harmful to the environment are no longer necessary. The device is the first cell counter to use DeNovix’s DirectPipette Technology, bringing to cell counting the straightforward Load, Measure, and Wipe Clean features of nano volume spectrophotometers. A variety of cell counting, viability, and transfection efficiency experiments are made possible by the combination of dual fluorescence and brightfield optics with the potent on-board EasyApps software. AUTOMATED CELL COUNTER MARKET GEOGRAPHY OVERVIEW North America The North American market, particularly the USA, will be one of the prime markets for (Automated Cell Counter) due to the nature of industrial automation in the region, high consumer spending compared to other regions, and the growth of various industries, mainly AI, along with constant technological advancements. The GDP of the USA is one of the largest in the world, and it is home to various industries such as Pharmaceuticals, Aerospace, and Technology. The average consumer spending in the region was $72K in 2023, and this is set to increase over the forecast period. Industries are focused on industrial automation and increasing efficiency in the region. This will be facilitated by the growth in IoT and AI across the board. Due to tensions in geopolitics, much manufacturing is set to shift towards the USA and Mexico, away from China. This shift will include industries such as semiconductors and automotive. Europe The European market, particularly Western Europe, is another prime market for (Automated Cell Counter) due to the strong economic conditions in the region, bolstered by robust systems that support sustained growth. This includes research and development of new technologies, constant innovation, and developments across various industries that promote regional growth. Investments are being made to develop and improve existing infrastructure, enabling various industries to thrive. In Western Europe, the margins for (Automated Cell Counter) are higher than in other parts of the world due to regional supply and demand dynamics. Average consumer spending in the region was lower than in the USA in 2023, but it is expected to increase over the forecast period. Eastern Europe is anticipated to experience a higher growth rate compared to Western Europe, as significant shifts in manufacturing and development are taking place in countries like Poland and Hungary. However, the Russia-Ukraine war is currently disrupting growth in this region, with the lack of an immediate resolution negatively impacting growth and creating instability in neighboring areas. Despite these challenges, technological hubs are emerging in Eastern Europe, driven by lower labor costs and a strong supply of technological capabilities compared to Western Europe. There is a significant boom in manufacturing within Europe, especially in the semiconductor industry, which is expected to influence other industries. Major improvements in the development of sectors such as renewable energy, industrial automation, automotive manufacturing, battery manufacturing and recycling, and AI are poised to promote the growth of (Automated Cell Counter) in the region.
Asia Asia will continue to be the global manufacturing hub for (Automated Cell Counter Market) over the forecast period with China dominating the manufacturing. However, there will be a shift in manufacturing towards other Asian countries such as India and Vietnam. The technological developments will come from China, Japan, South Korea, and India for the region. There is a trend to improve the efficiency as well as the quality of goods and services to keep up with the standards that are present internationally as well as win the fight in terms of pricing in this region. The demand in this region will also be driven by infrastructural developments that will take place over the forecast period to improve the output for various industries in different countries. There will be higher growth in the Middle East as investments fall into place to improve their standing in various industries away from petroleum. Plans such as Saudi Arabia Vision 2030, Qatar Vision 2030, and Abu Dhabi 2030 will cause developments across multiple industries in the region. There is a focus on improving the manufacturing sector as well as the knowledge-based services to cater to the needs of the region and the rest of the world. Due to the shifting nature of fossil fuels, the region will be ready with multiple other revenue sources by the time comes, though fossil fuels are not going away any time soon. Africa Africa is expected to see the largest growth in (Automated Cell Counter Market) over the forecast period, as the region prepares to advance across multiple fronts. This growth aligns with the surge of investments targeting key sectors such as agriculture, mining, financial services, manufacturing, logistics, automotive, and healthcare. These investments are poised to stimulate overall regional growth, creating ripple effects across other industries as consumer spending increases, access to products improves, and product offerings expand. This development is supported by both established companies and startups in the region, with assistance from various charitable organizations. Additionally, the presence of a young workforce will address various existing regional challenges. There has been an improvement in political stability, which has attracted and will continue to attract more foreign investments. Initiatives like the African Continental Free Trade Area (AfCFTA) are set to facilitate the easier movement of goods and services within the region, further enhancing the economic landscape. RoW Latin America and the Oceania region will showcase growth over the forecast period in (Automated Cell Counter Market). In Latin America, the focus in the forecast period will be to improve their manufacturing capabilities which is supported by foreign investments in the region. This will be across industries mainly automotive and medical devices. There will also be an increase in mining activities over the forecast period in this region. The area is ripe for industrial automation to enable improvements in manufacturing across different industries and efficiency improvements. This will lead to growth of other industries in the region. AUTOMATED CELL COUNTER MARKET MARGIN COMPARISON Margin Comparison Region Remarks (Highest to lowest) The supply chain demands and the purchasing power in the region enable suppliers to 1 Europe extradite a larger margin from this region than other regions. This is for both locally manufactured as well as imported goods and services in the region. Due to the high spending power in this region, the margins are higher compared to the North rest of the world, but they are lower than Europe as there is higher competition in this 2 America region. All the suppliers of goods and services target USA as a main market thereby decreasing their margins compared to Europe Lower purchasing power, coupled with higher accessibility of services in this regions doesn’t enable suppliers to charge a high margin making it lower than Europe and North 3 Asia America. The quality of goods and services are also affected due to this aspect in the region The margins are the lowest in this region, except for Australia and New Zealand as the Africa and 4 countries in this region don’t have much spending power and a large portion of the ROW products and services from this area is exported to other parts of the world INNOVATION INVESTMENTS BY REGION USA – $210 billion is allocated to federal R&D with main focus on health research, clean energy, semiconductor manufacturing, sustainable textiles, clean energy, and advanced manufacturing. Investments by private players are mainly focused on technological development including 5G infrastructure and AI in the region. Europe – EIC is investing €1 billion to innovative companies in sectors like AI, biotechnology, and semiconductors. There is also a focus on developing the ecosystem in the continent as well as improving the infrastructure for developing industries such as electric vehicles and sustainable materials. Private players are targeting data centers, AI, battery plants, and high end technological R&D investments. Asia – There are investments to tackle a range of scientific and technological advancements in this region mainly coming in from China, India, South Korea, and Japan. This will include artificial intelligence, 5G, cloud computing, pharmaceutical, local manufacturing, and financial technologies. Many countries are aiming to be digital hubs including Saudi Arabia. Africa – Investments in the region are focused on improving the technological capabilities in the region along with socio- economic development and growth. Private participants of investments in this region is venture capital dominated who are targeting the various growth elements of the region as social stability improves. The major industries are fintech, easier lending, and manufacturing. Latin America – The focus in the region is for fintech, e-commerce, and mobility sectors. There are also investments in improving manufacturing in the region. Local investments is focused on improving the healthcare, and transportation infrastructure in the region. The region is attracting foreign investments to improve their ability to utilize the natural resources present in the region. Rest of the World – The investments in this region are focused on clean energy, green metals, and sustainable materials. Funds in Australia are focused on solar energy and battery technologies, along with high end futuristic areas such as quantum computing. The main countries of private investment in ROW will be Australia, Canada, and New Zealand. AUTOMATED CELL COUNTER MARKET REPORT WILL ANSWER FOLLOWING QUESTIONS 1. How many automated cell counters are manufactured per annum globally? Who are the sub-component suppliers in different regions? 2. Cost breakup of a Global automated cell counter and key vendor selection criteria 3. Where is the automated cell counter manufactured? What is the average margin per unit? 4. Market share of Global automated cell counter market manufacturers and their upcoming products 5. Cost advantage for OEMs who manufacture Global automated cell counter in-house 6. key predictions for next 5 years in Global automated cell counter market 7. Average B-2-B automated cell counter market price in all segments 8. Latest trends in automated cell counter market, by every market segment 9. The market size (both volume and value) of the automated cell counter market in 2024-2030 and every year in between? 10. Production breakup of automated cell counter market, by suppliers and their OEM relationship RELATED REPORTS
MARKET REPORTS CONSUMER RESEARCH INFORMATION ADVISORY SERVICES CONTACT INFORMATION 172/1, 2nd Floor, 5th Main, 9th Cross Rd, Opposite to Kairalee Nikethan Education Trust, Indira Nagar 1st Stage, Bengaluru, Karnataka 560038, INDIA +1 217 636 3356, +44 20 3289 9440 sales@mobilityforesights.com Working Hours: Mon - Fri (9 AM - 9 PM IST) Connect with us © Copyright 2017-2023. Mobility Foresights. All Rights Reserved.