Download
1 / 8
0 likes | 3 Views
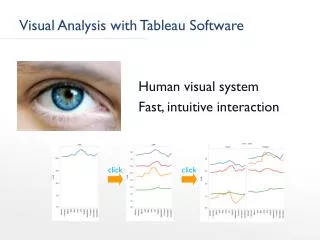
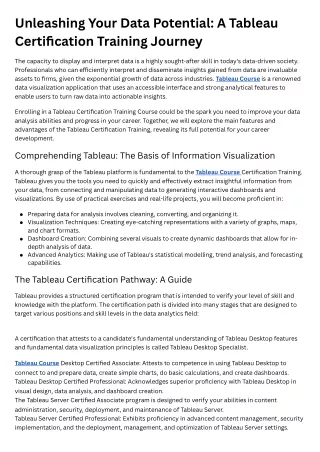
Thinking data, think Tableauu2014the ultimate tool for transforming raw numbers into stunning dashboards. Whether youu2019re eyeing the best online professional certificates or diving into live courses for professionals, a clear Tableau roadmap is your secret weapon. Start with basic charts, move to calculated fields, and then master dashboard storytelling and integration. With hands-on learning and real-world case studies, youu2019ll be visualizing insights like a pro in no time!<br><br>Join TutorT Academy to fast-track your Tableau journey with expert mentors and curated content.

E N D
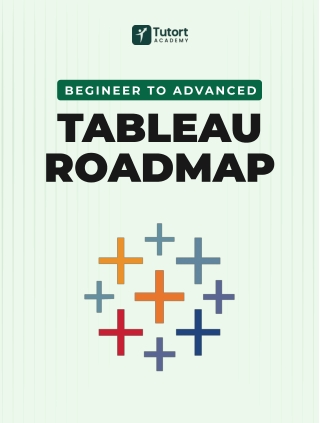
Begineer To ADVANCED Tableau Roadmap
TOPICS TO COVER IN DIFFERENT LEVELS: Beginner Level Introduction to TableaU Data Connection and Loading Basic Visualization Calculations and Expressions Filters and Parameters Intermediate Level Advanced Visualizations Dashboard Creation Data Blending Advanced Calculations Geospatial Analysis Curated by
TOPICS TO COVER IN DIFFERENT LEVELS: Advanced Level Performance Optimization Advanced Dashboarding Server Deployment Automation and Integration Certification and Community Engagement This consolidation strategy helps solidify your Tableau skills, ensuring that you not only learn but also retain and apply your knowledge effectively. All the Best Curated by
Level 1: Beginner Level Month 1 Introduction to Tableau Week 1-2 Day 1-3 Install Tableau Desktop and navigate the interface. Day 4-6 Connect to simple data sources (e.g., Excel, CSV). Day 7-10 Create basic visualizations like bar charts and line charts. Day 11-14 Explore the Show Me feature for quick visualization options. Data Preparation and Basic Calculations Week 3-4 Day 15-18 Understand data types and clean data. Day 19-21 Practice filtering and parameter usage. Day 22-25 Learn basic calculations (e.g., SUM, AVG). Day 26-28 Work with IF statements and simple calculated fields. Curatedby
Level 2: Intermediate Month 1 Advanced Visualizations and Dashboards Week 5-6 Day 29-32 Explore advanced chart types (e.g., heat maps, tree maps). Day 33-36 Create simple interactive dashboards with multiple sheets. Day 37-40 Understand actions and filters for interactivity. Day 41-44 Customize chart styles and layouts. Data Blending and Geospatial Analysis Week 7-8 Day 57-60 Learn data blending to combine data from multiple sources. Day 61-64 Create basic maps and understand geospatial analysis. Day 65-68 Customize map visualizations with background images. Day 69-72 Work with dual-axis charts for enhanced data representation. Curated by
Level 3: Advanced Month 1 Performance Optimization and Server Deployment Week 9-10 Day 85-88 Optimize workbook performance (aggregation, indexing). Day 89-92 Learn about Tableau Server or Tableau Online. Day 93-96 Publish your workbooks and explore permissions. Day 97-100 Dive into data source filters and data extracts (TDEs). Advanced Calculations and Automation Week 11-12 Day 113-116 Master advanced calculations (table calculations, LOD expressions). Day 117-120 Explore automation using Tableaus APIs. Day 121-124 Prepare for Tableau Desktop Certified Associate certification (optional). Curated by
Consolidation Strategy: During the consolidation phase, aim to reinforce your Tableau skills and deepen your understanding through real-world projects and continuous practice: Work on a personal or sample project where you can apply a variety of Tableau techniques and visualizations. Explore advanced features and customizations in Tableau by attempting more complex projects and experimenting with different data sources. Engage with the Tableau community by sharing your projects and seeking feedback on forums or social media. Collaborate with others and learn from their experiences. Review and revisit key concepts from the past three months, especially in areas where you may feel less confident. Try to explain Tableau concepts to someone else to reinforce your own understanding. This consolidation strategy helps solidify your Tableau skills, ensuring that you not only learn but also retain and apply your knowledge effectively. Curated by
Start Your Upskilling with us Explore our courses Data Analytics and Business Analytics Program Data Science and Artificial Intelligence Program www.tutort.net Read more on Quora Watch us on Youtube Follow us on