Full Chart Pack
... Survey, data for community hospitals. ... raising management challenges for hospitals. ... Full-service hospitals are equipped to respond to over 1000 ...

Full Chart Pack
E N D
Presentation Transcript
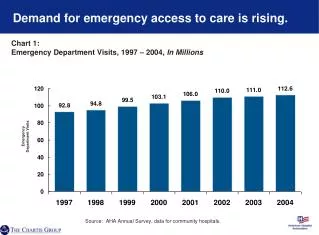
Demand for emergency access to care is rising. Chart 1: Emergency Department Visits, 1997 – 2004, In Millions Emergency Department Visits Source: AHA Annual Survey, data for community hospitals.
Most emergency department patients have immediate health care needs. Chart 2:Emergency Department Visits by Level of Urgency, 2003 15% Emergent (should be seen in less than 15 minutes) No Triage/Unknown 17% Non-urgent 13% (should be seen in 121 minutes to 24 hours) 35% Urgent (should be seen in 15-6 minutes) Semi-urgent 20% (should be seen in 61-120 minutes) Source: Centers for Disease Control and Prevention, National Ambulatory Medicare Care Survey: 2003 Emergency Department Summary.
Emergency care demand is highly unpredictable and can vary greatly by time of day… Chart 3: Emergency Department Visits by Hour of Day, October 1–31, 2004 Source: New Britain General Hospital, New Britain, CT.
…and day of week, raising management challenges for hospitals. Chart 4: Emergency Department Visits by Day of Week, November 17–30, 2004 Source: New Britain General Hospital, New Britain, CT.
Decreasing resources for behavioral health care have led more patients to turn to the ED for care. Figure B: Behavioral Health-Related Emergency Department Visits, 1994/95–2001/02 In Millions Figure A: Inpatient Psychiatric Facilities, 1995–2004 2169 1816 Source: Gregory Luke Larkin et al., Trends in U.S. Demand in U.S. Emergency Department Visits for Mental Health Conditions, 1992 to 2001; Psychiatric Services 56:671-677, June 2005. Source: AHA Annual Survey of Hospitals, 1995-2004.
Common patient conditions require a wide variety of resources to be available 24/7. Chart 5: Example: Resource Needs for Common Condition Source: King’s Daughter Medical Center, Brookhaven, MS.
Rural hospitals often serve large geographic areas. Figure C: Geographic Region Served by King’s Daughter Medical Center Population Source: King’s Daughter Medical Center, Brookhaven, MS.
Full-service hospitals are equipped to respond to over 1000 unique conditions. Chart 6: Emergency Visits and Conditions Treated Example: New Britain General Hospital, FY 2005 1,730 Upper Respiratory Tract Infection In 2005, New Britain General Hospital Treated over 63,000 patients with over 1,690 unique conditions 1,720 Viral Infection Ear Infection 1,560 Asthma 1,500 Abdominal Pain 1,450 Alcohol Abuse 1,430 1,380 Acute Bronchitis Acute Pharyngitis 1,300 1,280 Open Wound of Finger 1,210 Pneumonia Other 48,430 Source: New Britain General Hospital, New Britain, CT.
Victims of accidents or violent crimes often are transported to Level I trauma centers… Chart 7: Accidents Cared for at Level I Trauma Centers, 2001 – 2004 Source: National Trauma Data Bank, 2004.
…where extensive and highly specialized resources are available 24/7. Chart 8: Selected Resource Requirements for Level I Trauma Centers Clinical capabilities immediately available… …supported a wide array of caregiver resources… …and specialized equipment • Anesthesia • Cardiac surgery • Critical care medicine • General surgery • Hand surgery • Micro vascular/replant surgery • Neurosurgery • Obstetrics/Gynecology • Ophthalmic surgery • Oral/maxillofacial surgery • Orthopedic surgery • Plastic surgery • Radiology • Surgical ICU service with physician in-house 24/7 • Thoracic surgery • Radiology Services 24/7 • X-Ray • Angiography • Sonography • CT • MRI • Operating room personnel in-house 24/7 • Post-anesthetic recovery room nurses 24/7 • Intensive/critical care nurses with trauma education • Respiratory therapy services 24/7 • Clinical laboratory service • Hemodialysis • Physical, occupational and speech therapy Operating Room Equipment • Operating microscope • Thermal control equipment • Radiology C-Arm • Endoscopes/bronchoscope • Craniotomy instruments • Equipment long bone and pelvic fixation • Rapid infuser system ED Equipment • Resuscitation equipment • Standardized IV fluids and administration sets • Large-bore intravenous sets • Arterial catheters Source: American College of Surgeons: Resources for Optimal Care of the Injured Patient, 1999.
Hospitals provide many community services for low-income populations and the community at large. Chart 9: Percentage of Community Hospitals Offering Selected Community Services, 2004 Source: Health Forum, Hospital Statistics, 2006.
Medicaid beneficiaries use more ED care than other populations. Chart 10: Emergency Department Visits per 100 Population by Immediacy of Patient Condition, 2003 Visits per 100 Populations Source: Chartis Group Analysis of National Hospital Ambulatory Medical Care Survey, 2003.
The number of Medicaid beneficiaries has more than doubled since 1990. Chart 11:Medicaid Enrollees(1), 1990 – 2004 (In Millions) 57.3 M 44.5 M 36.3 M Millions 25.3 M Source: Centers for Medicare & Medicaid Services; 2004 data, CBO March 2005 Baseline. (1) Does not include S-CHIP Enrollees
The proportion of physicians providing office/clinic-based charity care is declining. Chart 12: The Percent of Physicians Providing Office/Clinic Based Charity Care, 1996/97 – 2004/05 Source: Center for Studying Health System Change, A Growing Hole in the Safety Net: Physician Charity Care Declines Again, Tracking Report No. 13, March 2006.
EDs serve proportionally more Medicaid and uninsured patients than physician offices. Chart 13: Percent of Total Visits by Expected Source of Payment, Emergency Departments vs. Physician Offices, 2003 Source: Centers for Disease Control and Prevention, National Ambulatory Medical Care Survey; National Hospital Ambulatory Medical Care Survey.
Hospitals plan for multiple types of disasters. Chart 14: Percent of Hospitals with Response Plans by Type of Incident, 2003 Source: Centers for Disease Control and Prevention, Bioterrorism and Mass Casualty Preparedness in Hospitals: United States, 2003.
Hospitals in all regions must be prepared for a range of natural and manmade disasters. Chart 15: Selected Recent U.S. Disasters Source: National Hurricane Center; Wikipedia; FEMA: Taking Shelter from the Storm: Building a Safe Room Inside Your House; The National Coalition For School Bus Safety; National Transportation Safety Board; Michigan Tech (http://www.geo.mtu.edu/UPSeis/area.html)
Disaster response in hurricane zones can last for days and require hospitals to play many different roles. Figure D: Hurricane Response: Baptist Hospital, Pensacola Day 1 Day 2 Day 3 Day 4 Day 5+ • Hurricane alert – hurricane expected to hit land in two days • Hospital begins to procure supplies, including gas, food, lumber and water • Hospital prepares ancillary power generators, sets up extra cots, installs portable toilets and boards windows • Elective surgical and ancillary procedures are postponed and some patients well enough to return home are discharged • Sunny day but clouds roll in quickly and winds begin to gust • Hospital continues preparation activities • Hospital develops emergency staffing schedules and sets up daycare for employees’ children • In the evening, community members arrive at the hospital’s front door with pillows, blankets, bags and pets in tow; Many are pregnant or elderly – no one is turned away • Torrential rain • and gusting winds • Occasionally the sound of broken glass or objects hitting the building can be heard • Care provided for the injured • Shelter provided for hundreds of people and their pets • Daycare is provided for employees’ children • Hospital kitchen continues to operate and feeds the hungry • Light rain with occasional sunshine • Roads are littered with branches and trees, electricity is out, and there is no running water • Hundreds remain sheltered, and daycare and kitchen operations continue • Cleanup of the hospital’s grounds begins – can’t get cars out until the roads are cleared • Community members flock to the hospital cafeteria – the only place providing food in town • Sunny day • Roads are reopening but many are closed • Utilities come back online throughout the day • Many of those seeking shelter do not leave because the roads to their homes are impassible or their homes are severely damaged • Cleanup of the hospital’s grounds continues • Elective procedures continue to be postponed Conditions Preparedness/Response Activities Source: Baptist Medical Center, Pensacola, FL.
Hospitals currently face workforce shortages in key care-giving professions… Chart 16: Vacancy Rates for Selected Hospital Personnel, December 2005 Source: AHA Survey of Hospital Leaders, 2006.
By 2020, demand will outstrip supply by 1 million for registered nurses… Chart 17: Registered Nurse FTEs: Supply and Demand, 2000 – 2020 RN FTE Demand In 2020, there will be a shortage of 1 million nurses FTEs in Thousands RN FTE Supply Source: National Center For Health Workforce Analysis, Bureau of Health Professions, Health Resources and Services Administration, 2004.
…and 84,000 physicians. Chart 18: Physician Supply and Demand, 2000 – 2020 In 2020, there will be a shortage of 84,000 physicians Specialist Physicians Generalist Physicians Specialist Demand Generalist Supply Thousands Thousands Generalist Demand Specialist Supply Source: College of Graduate Medical Education, Physician Workforce Policy Guidelines for the United States, 2000-2020.
As the number of patients seeking ED care has risen, the number of EDs has declined. Chart 19: Emergency Department Visits and Emergency Departments(1) in Community Hospitals, 1991 – 2004 Emergency Departments Emergency Department Visits (Millions) Source: The Lewin Group analysis of American Hospital Association Annual Survey data, 1991 – 2004, for community hospitals. (1)Defined as hospitals reporting ED visits.
Hospitals face a growing payment shortfall from Medicare and Medicaid. Chart 20:Hospital Payment Shortfall Relative to Costs for Medicare and Medicaid Patients in Billions, 1997 – 2004 2002 2000 2003 1999 1998 2001 2004 1997 Medicare Billions of Dollars Medicaid Total Shortfall in 2004: $22 Billion Source: AHA Annual Survey, data for community hospitals
The majority of physician-owned limited-service hospitals do not provide the 24/7 standby role… Chart 21:Percent of Hospitals with an Emergency Department*, Physician-owned Limited-service Hospitals versus All Community Hospitals, 2003 Source: Centers for Medicare & Medicaid Services, Study of Physician-owned Specialty Hospitals Required in Section 507(c)(2) of the Medicare Prescription Drug, Improvement, and Modernization Act of 2003, 2005. AHA Annual Survey, 2003. *Hospitals treating more than 5% of cases in emergency department.
…and provide relatively less care to low income populations. Chart 22: Medicaid as a Percent of All Patient Discharges, 2002 Physician-owned Source: Medicare Payment Advisory Commission, Physician-owned Specialty Hospitals, March 2005.
Outpatient surgical care is shifting from hospitals to other settings. Chart 23: Percent of Outpatient Surgeries by Facility Type, 1981 – 2005 Physician Offices 17% Freestanding Facilities 38% Hospital-based Facilities 45% Source: Verispan’s Diagnostic Imaging Center Profiling Solution, 2004. *2005 values are estimated based upon current trends.