Download
1 / 9
100 likes | 172 Views
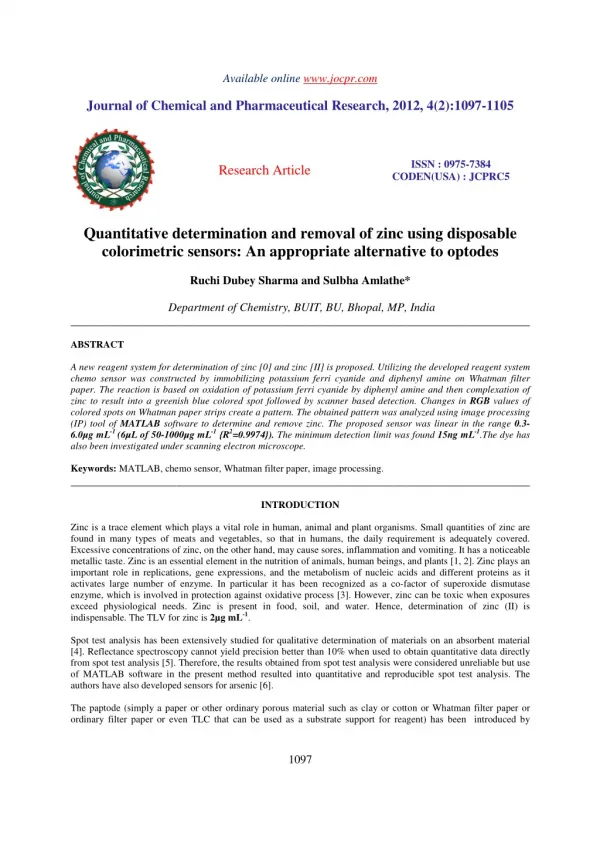
A new reagent system for determination of zinc [0] and zinc [II] is proposed. Utilizing the developed reagent system<br>chemo sensor was constructed by immobilizing potassium ferri cyanide and diphenyl amine on Whatman filter<br>paper. The reaction is based on oxidation of potassium ferri cyanide by diphenyl amine and then complexation of<br>zinc to result into a greenish blue colored spot followed by scanner based detection. Changes in RGB values of<br>colored spots on Whatman paper strips create a pattern. The obtained pattern was analyzed using image processing<br>(IP) tool of MATLAB software to determine and remove zinc. The proposed sensor was linear in the range 0.3-<br>6.0µg mL-1 (6µL of 50-1000µg mL-1 {R2<br>=0.9974}). The minimum detection limit was found 15ng mL-1.The dye has<br>also been investigated under scanning electron microscope. <br>

E N D
Available online www.jocpr.com Journal of Chemical and Pharmaceutical Research, 2012, 4(2):1097-1105 ISSN : 0975-7384 CODEN(USA) : JCPRC5 Research Article Quantitative determination and removal of zinc using disposable colorimetric sensors: An appropriate alternative to optodes Ruchi Dubey Sharma and Sulbha Amlathe* Department of Chemistry, BUIT, BU, Bhopal, MP, India ______________________________________________________________________________ ABSTRACT A new reagent system for determination of zinc [0] and zinc [II] is proposed. Utilizing the developed reagent system chemo sensor was constructed by immobilizing potassium ferri cyanide and diphenyl amine on Whatman filter paper. The reaction is based on oxidation of potassium ferri cyanide by diphenyl amine and then complexation of zinc to result into a greenish blue colored spot followed by scanner based detection. Changes in RGB values of colored spots on Whatman paper strips create a pattern. The obtained pattern was analyzed using image processing (IP) tool of MATLAB software to determine and remove zinc. The proposed sensor was linear in the range 0.3- 6.0µg mL-1 (6µL of 50-1000µg mL-1 {R2=0.9974}). The minimum detection limit was found 15ng mL-1.The dye has also been investigated under scanning electron microscope. Keywords: MATLAB, chemo sensor, Whatman filter paper, image processing. ______________________________________________________________________________ INTRODUCTION Zinc is a trace element which plays a vital role in human, animal and plant organisms. Small quantities of zinc are found in many types of meats and vegetables, so that in humans, the daily requirement is adequately covered. Excessive concentrations of zinc, on the other hand, may cause sores, inflammation and vomiting. It has a noticeable metallic taste. Zinc is an essential element in the nutrition of animals, human beings, and plants [1, 2]. Zinc plays an important role in replications, gene expressions, and the metabolism of nucleic acids and different proteins as it activates large number of enzyme. In particular it has been recognized as a co-factor of superoxide dismutase enzyme, which is involved in protection against oxidative process [3]. However, zinc can be toxic when exposures exceed physiological needs. Zinc is present in food, soil, and water. Hence, determination of zinc (II) is indispensable. The TLV for zinc is 2µg mL-1. Spot test analysis has been extensively studied for qualitative determination of materials on an absorbent material [4]. Reflectance spectroscopy cannot yield precision better than 10% when used to obtain quantitative data directly from spot test analysis [5]. Therefore, the results obtained from spot test analysis were considered unreliable but use of MATLAB software in the present method resulted into quantitative and reproducible spot test analysis. The authors have also developed sensors for arsenic [6]. The paptode (simply a paper or other ordinary porous material such as clay or cotton or Whatman filter paper or ordinary filter paper or even TLC that can be used as a substrate support for reagent) has been introduced by 1097
Sulbha Amlathe et al ______________________________________________________________________________ J. Chem. Pharm. Res., 2012, 4(2):1097-1105 Abbaspour et. al for speciation of iron (II) / iron (III) [7] and disposable sensors for hydrazine [8]. The ground for work of Abbaspour et. al. was indicator tube and strip preparation by Amlathe and Gupta [9, 10]. A Colored reaction product can be produced by a single drop of solution of analyte on the surface of reagent impregnated inert support, producing distinct specific pattern. This local accumulation accompanying spot reaction enhances discernibility of colored reaction products, especially if they are insoluble in aqueous media, or when colored water soluble reaction products are adsorbed on the support and hence is very important [4]. Intensity of colored spot was found to be proportional to the concentration of the analyte. The spots were scanned using a flatbed scanner and the obtained images have been transferred to computer for analysis and the intensity of color-spots was determined. This color analyzing program enables us to select a specific area for analysis. The number of pixels that can be indicated by the specific area was about 10000-300000, and the program can average the pixels. Therefore, the signal to noise ratio can be increased dramatically. Furthermore, the problem of inhomogeneous media, which was problematic in reflectance spectroscopy, is not important here due to averaging the intensity of each color-spot. Area of the spots which were used to measure the color intensity was a square with 62500dpi (250×250 dpi). The spots were not perfectly homogenous; therefore, we have selected the central area of spot for analyzing the color. There are many methods for determination of zinc such as spectrophotometry [11–13], atomic absorption spectrometry [14, 15], flame atomic absorption spectroscopy [16-17], graphite furnace atomic absorption spectrometry [18-19], inductively coupled plasma atomic emission spectroscopy [20], inductively coupled plasma mass spectrometry [21], anodic stripping voltammetry [22] and flow injection spectrophotometric method [23] etc. In the proposed method, we have described the use of paptode for analysis of zinc. EXPERIMENTAL SECTION 2.1 Apparatus and software: JEOL JSM -6390 A SEM Made in Japan, JEOL JFC-1600 Sputter Coater unit. The scanner (HP-SCANJET G2410).Resolution of scanner was regulated at 300 dpi. For analyzing color values in RGB (red, green, blue) system, the MATLAB software, which was written in Visual Basic 6 Media, was used. A lambda pipette was used for injecting samples on strips. 2.2. Chemicals and Reagents: All reagents used were analytical grade chemicals. Double distilled water is used throughout the experiment. Zinc stock- A stock of 1000 µg mL-1 was prepared by dissolving 196.81mg of Zn3 (PO4)2 in 100 ml of double distilled water. Diphenylamine– 0.25% diphenylamine solution was prepared by dissolving 250 mg of diphenylamine in 100 ml of alcohol. 2.3. Procedure: The presence of zinc produces a light metallic blue to deep metallic green colored spot on the sensors. To construct the sensor strips for Whatman filter paper were immersed in 3.5% solution of potassium ferri cyanide followed by immersing in 0.25% diphenylamine solution for few seconds and then dried in a temperature controlled oven (to speed up drying). Aliquots of 6µL of solutions were injected on these strips to develop the spot. The strips were scanned and R, G and B values of spots were recorded by MATLAB after development of the spot. The RGB color model is an additive color model in which red, green and blue light are added in various ways to produce a broad array of colors. Any color can be analyzed to obtain its corresponding R, G and B value. Effective intensity for any color values of color spots was calculated by following formulae: Ar = -Log (Rs/Rb)……… (1); Ag = -Log (Gs/Gb) ……….. (2); Ab = -Log (Bs/Bb)…………….. (3) Where, Ar,Ag, Ab are effective intensities of red, green and blue color respectively ,Rs, Gs, Bs and Rb, Gb, Bb refer to R, G and B values of sample and blank respectively. The calibration curve is obtained by plotting effective intensities of R, G and B values vs. analyte concentration. 1098
Sulbha Amlathe et al ______________________________________________________________________________ J. Chem. Pharm. Res., 2012, 4(2):1097-1105 RESULTS AND DISCUSSION 3.1 Chemical reaction: Potassium ferri cyanide oxidizes diphenylamine and potassium ferro cyanide is formed. The developed ferro cyanide ion are collected by zinc to form zinc ferro cyanide which then adsorbs the quinoidal oxidation product of diphenylamine to result into light metallic blue to deep metallic green colored spot [24]. Photograph: Color variation before and after adding zinc sample. Where, B- Blank; (a) - Color variation in solution; (b) - Color variation on strips Reaction: Potassium Ferri cyanide + Diphenylamine → Oxidized diphenyl amine + Potassium Ferro cyanide Potassium Ferro cyanide + Zinc (acidic solution) →Zinc Ferro cyanide Zinc Ferro cyanide + oxidized diphenylamine →Complex (Light blue to deep metallic Green) The dye has also been examined using scanning electron microscope (SEM) after gold coating. In SEM images dye appears stony lump structure. Micrograph: 1 Micrograph: 2 SEM Micrograph 3.2. Optimization of conditions: 3.2.1. Injection volume: The influence of volume of analyte which must be injected onto strip was investigated. The optimum sample volume was obtained to be 6µL.Increased volume injection leads to more diffusion of spots and thus consequently decreases the intensity of color (figure: 1). 1099
Sulbha Amlathe et al ______________________________________________________________________________ J. Chem. Pharm. Res., 2012, 4(2):1097-1105 Fig.: 1 Optimization of zinc volume Effect of potassium ferri cyanide Effect of diphenylamine 3.2.2. Effect of reagent concentration: In order to study the effect of potassium ferri cyanide and diphenylamine concentration, solutions with various concentrations of reagents was prepared and immobilized on Whatmann paper strips and then allowed to dry. After drying 6µL of a standard solution containing 100µg mL-1 of zinc was injected on each strip. Injection of analyte produces the colored spot immediately, the strips were scanned after drying (2- 5minute) and their colors were analyzed by the software, and the effective intensities of R, G and B values were plotted vs. concentration of potassium ferri cyanide and diphenylamine. Figure 2 shows the effect of concentration of potassium ferri cyanide on spot intensities. At 3.5% concentration of potassium ferri cyanide maximum color intensity was observed and hence selected as optimum (figure 2). Figure 3 shows the effect of concentration of diphenylamine on effective intensities of spot, 0.25% of diphenylamine has been selected as optimum as maximum effective intensity was recorded at this concentration (figure 3). 3.3. Drying Methods: We have employed different methods of drying such as drying at room temperature, in an oven and hot air strips after injection of reagent onto strips but no considerable change in signals was observed. However, an oven is recommended for increasing the rate of drying. 3.4. Effect of Temperature: The effect of temperature has been studied from room temperature to 700C for injection of zinc as well as after injection of zinc. No considerable change in RGB has been observed. 3.5. Effect of Time: 3.5.1. Response Time: The response time of the system was evaluated under optimum conditions for 200µg mL-1. It is the time required to achieve maximum color intensity. In the proposed method spot of maximum color intensity develops immediately after the injection of analyte. 3.5.2. Stability of spots: To study the stability of color spots, 200µg mL-1of zinc was injected under optimum conditions on the sensor. Scanning of the sensor was done in the time period of 2, 5, 20, 40, 70, 90, 120, 150, 180 and 210 minute. No change at all is observed in B values for 70 minute, R and G values are also nearly ineffective. A little decrease in RGB has been observed after 70 minute but then after the values was found nearly constant till 3 hour. Therefore, the sensing spot is stable most effectively for 1 hour and 10 min after injection of sample rather it can be analyzed within 3 hour for good results. 3.5.3. Stability of sensor: For studying the stability of sensors, the sensors were prepared using optimized conditions and were stored at room temperature; the prepared sensors were then used periodically each day. No significant change was observed within 15 days; afterwards spot of same intensity develops but vanishes within 15 minute. Therefore, the prepared sensors can be effectively used for 15 days. 3.5.4. Detection Limit (DL): For each RGB factor there is one DL [8].Theoretical DLs of the method were 0.06 µg mL-1 (6µL of 10 µg mL-1) for R, G and 0.03 µg mL-1 (6µL of 5 µg mL-1) for B values respectively. Practical DL determined was 15ng mL-1(3µL of 5 µg mL-1). The practical DL is the lowest concentration, which gives color on strip no matter falls inlinearity range or not. 3.6. Calibration Curves: For obtaining calibration curve the effective intensities of spot were plotted against 50- 1000 µg mL-1 of zinc for all three values (R, G and B).The increase in effective intensity with increasing concentration has been observed and linearity co-efficient has been found 0.9922, 0.9785 and 0.969 respectively for Fig.: 2 Fig.: 3 1100
Sulbha Amlathe et al ______________________________________________________________________________ J. Chem. Pharm. Res., 2012, 4(2):1097-1105 R G and B values (figure 5.1). From figure 5.1 and 5.2 it is clear that rather B values are higher but linearity co- efficient (R2=0.9922, 0.9949) is higher for R values. When calibration graph was obtained for 200-500µg mL-1, B values were found with highest linearity coefficient (0.9974) along with highly sensitive values (figure 5.3). Therefore, all R, G and B values can be equally considered but G values are less sensitive. We recommend R values for their consistent linearity and B values for their high sensitivity and reproducibility. Fig.: 5.1 50-1000µg mL-1 of Zn 600-1000µg mL-1of Zn 200-500µg mL-1of Zn Fig.: 5.2 Fig.: 5.3 CALIBRATION CURVES 3.7. Reproducibility of the system: Reproducibility of sensor has been investigated at seven sensors proposed in similar fashion under optimum conditions for various concentrations of zinc. The results are reported in table1 and conclude that the proposed method is reproducible. Table: 1 Average, SD (standard deviation) and RSD (relative standard deviation) of repetitive analysis S. No. solution Ar Ar Ar 1. 200 0.0932 0.008 9.51 0.0805 2. 500 0.1757 0.0047 2.67 0.1440 3. 1000 0.3950 0.01672 4.23 0.3341 Where; Ar = -log of R value of sample/R value of blank Ag = -log of G value of sample/G value of blank Ab = -log of B value of sample/B value of blank 3.8. Interference studies: To study the selectivity of the proposed method, the effect of various species on the determination of 1000µg mL-1 of zinc was tested under optimum conditions without any masking. The tolerance limit was defined as the concentration of the added species that causes ± 5 % relative error. The results are indicated in Table 2. Table: 2: Tolerance limit of various interfering species on determination of zinc S.No. Interfering species 1 Mn2+ 2 K+, Cr3+, 3 As3+ 4 Ca2+ 5 Se3+, 6 Fe2+, NH4+, SO42 - 7 Cu2+, Cd2+, Pb+ 8 Al3+ 9 Na+, HCO32- 10 Hg2+ 11 Ba2+, Cl- µg mL -1of zinc Avg. SD RSD Avg. Ag SD Ag 0.015 0.0072 0.0095 RSD Ag 19.67 5.04 2.85 Avg. Ab 0.1441 0.2199 0.4082 SD Ab RSD Ab 11.9 8.76 5.48 0.01726 0.01927 0.022 Tolerance limit (mgL-1) 2500 7500 40 5000 80 1000 400 5000 2000 300 800 1101
Sulbha Amlathe et al ______________________________________________________________________________ J. Chem. Pharm. Res., 2012, 4(2):1097-1105 3.9. Application of Disposable Sensors: 3.9.1. In Analysis of real samples: To check the applicability of the method the proposed sensors were used to analyze zinc in real samples containing zinc i.e. rice, wheat, vegetables (cabbage, spinach), milk, urine samples and laboratory effluent water. Some heavy metals are reported to be present in urine [25].Using the calibration curve; the concentration of zinc in above samples was calculated. The results are given in Table 3. The results reveal that zinc can be determined quantitatively in the region assessed. Table: 3: % recovery of zinc in environmental samples. S. No. Sample Zinc originally found Lab Waste Water - 1 -2 Not found Grains --A. Rice -1 -2 -3 B. Wheat -1 -2 -3 750 µg Vegetable A. Spinach -1 -2 -3 B. Cabbage -1 -2 -3 150 µg Milk - 1 - 2 1000 µg Urine -1 - 2 200 µg 3.9.2. In Removal of Zinc: Heavy metal ions are highly toxic for animals and human beings. Presence of such toxic heavy metal in drinking water system is a potential health hazard. Heavy metal ions pose a series risk to the environment and endanger public health and the environment. The water contamination by toxic metals through the discharge of industrial wastewaters is a worldwide environmental problem. The industries responsible for the discharge of wastewaters containing metals are mining and mineral processing, pigment manufacture, painting and photographic industries, metal-working and finishing processes. Since metals are non biodegradable, and may be bio-accumulated in living tissues, their removal from wastewaters is nowadays legally imposed [26]. Thus, there is a hunger need for a cost effective method for removal of heavy metals from water. Various methods have been reported for removal of heavy metal ions. Separation through chromatography [27] and adsorption on various low cost adsorbent [28-29] are cost effective. The proposed sensor was also successfully used for removal of zinc from aqueous sample. There are various methods reported for removal of zinc by plant/plant material/plant waste [30-33], ultra filtration [34-35], electrocoagulation [36-37], membrane filtration [38], sorptive filtration [39], adsorbents [40-42], phyto catalytic removal [43] and by carbon nano fiber [44] However; out of these methods some suffer from the complete elimination of heavy metals at very low concentrations , some are expensive as these require advanced equipment and high energy others too have varied limitations. The proposed disposable sensors are easy to be utilized, do not require any skilled labor or operation or instrument, instantaneous to adsorb and remove zinc. To apply these sensors for removal of zinc different concentration are allowed to be filtered through it and the sensors were scanned before and after adsorption to know the change in RGB values. It is observed that adsorption increases with decrease in concentration of analyte from 3000-800 µg mL-1 but then after decrease in adsorption has been observed (Figure: 6). It may be due to saturation of filter because increase in size of filter increases the % removal, studies are undergoing. The disposable filter is allowed to remain in contact of 1000µg mL-1 zinc solution for an hour and change in value is observed at every 15 minute. It is found that best adsorption took place within 15 minute. (Figure: 7) Zinc added 200µg 1000µg 100 µg 200 µg 500 µg 100 µg 200 µg 500 µg 100 µg 200 µg 1000 µg 100 µg 200 µg 1000 µg 100 µg 200 µg 100 µg 200 µg Total Zinc found 190g 980µg 850 µg 1000 µg 1250 µg 800 µg 900 µg 1400 µg 250 µg 350 µg 1000 µg 190 µg 280 µg 1100 µg 1100 µg 1150 µg 400 µg 400 µg % recovery 95.0 98.0 94.4 90.9 96.1 100.0 94.7 100.3 83.3 87.5 83.3 95.0 93.3 95.6 100.0 95.8 100.0 100.0 1 Not found 800 µg 900 µg 800 µg 700 µg 750 µg 2 200 µg 200 µg 200 µg 100 µg 100 µg 3 1000 µg 4 300 µg 5 1102
Sulbha Amlathe et al ______________________________________________________________________________ J. Chem. Pharm. Res., 2012, 4(2):1097-1105 Fig.: 6: Effect of concentration on adsorption Fig.: 7: Effect of Contact time on Removal CONCLUSION Many spot test methods were been reported by Fiegl [45], the proposed spot analysis is superior to all of them in terms of being quantitative and highly sensitive. The method we have proposed in this paper is found to be superior over existing methods for determination of zinc being simple rapid, selective, sensitive and inexpensive (table 5). The method is also applicable for effective removal of zinc. Moreover, application of flatbed scanner enables the use of non-transparent supporting substrates and as in the proposed method the reflection properties of strips were measured instead of absorbance or transmittance, thus turbid samples can also be analyzed without any interference. In the proposed method, it is possible to save experimental data, as well as images of results (e.g. the colorful complex) in the computer, and then they could be reviewed for applying more powerful software on it in the future. The porosity of support-based materials in these sensors causes shorter response time as compared with the typical response time in optodes; portability and ease of reagent immobilization are considerable advantages. The sensor can be used in for testing zinc in various grain, vegetables, water and biological samples. Table: 5 Comparison of proposed method with other methods Range of Determination Detection limit 0.42 µg mL-1 S.No. Reagents Method Remarks Flow injection spectrophotometry, 2-360 µg mL-1 1 PAN [23] Less sensitive Copper(II), cobalt(II), iron (III) and iron(II) ions interfered nickel(II), cadmium(II), 7-(4-Nitrophenylazo)-8- Hydroxyquinoline-5-Sulfonic Acid [46] 15 ng mL- 1 0.05-1.0 µg mL-1 2 Spectrophotometry Differential pulse anodic stripping voltammetry 14.7 µg mL-1 100–400 µg mL-1 3 Glassy Carbon electrode [47] Non selective Zincon (2-carboxy-20-hydroxy- 50-sulfoformazylbenzene) [48] 4 Spectrophotometry, 1.19µM-5.11µM 210nM Non selective 10 µg mL- 1 10 µg mL- 1 10-250 µg mL-1 5 EM Quant Dithizone [49] Spot test Semi quantitative 10-250 µg mL-1 6 Merckoquant® [50] Spot test Semi quantitative MATLAB spectroscopy method) assisted (Proposed Quantitative, rapid, highly sensitive, new approach. cheap, Potassium diphenylamine ferricyanide and 0.3-6.0 µg mL-1 15ng mL-1 7 Acknowledgement The authors are grateful to Director, Madhya Pradesh Council of Science and Technology (MPCST), Bhopal, MP, India for providing financial assistance, Director, Advanced Material Preparation and Research Institute (AMPRI), Bhopal, MP, India, Director, Maulana Azad National Institute of Technology, Bhopal, MP, India,for providing instrumental facilities, Principal, Govt. Sarojini Naidu Girls College Bhopal and Director, BUIT Barkatullah University Bhopal for providing lab facilities. 1103
Sulbha Amlathe et al ______________________________________________________________________________ J. Chem. Pharm. Res., 2012, 4(2):1097-1105 REFERENCES [1]. A. Brunborg; K. Julshamn; R. Nortvedt and L. Froyland, Food Chemistry, 2006, 96(4), 524–531. [2]. R. J. Van Saun, Small Ruminant Research, 2006, 61(2-3), 153–164. [3]. C. Terres; M. Navarro; L. Marttin et.al, Food additives and Contaminants, 2001, 18, 687. [4]. F. Feigl and V. Anger, Spot test in inorganic analysis, 6thed, Elsevier, Amsterdam, first Indian reprint, 2005. [5]. D. Kealey, Quantitative reflectometry-I: Principles and scope, Talanta, 1972, 19, 1563. [6]. R. D. Sharma; S. Joshi and S. Amlathe, Anal. Methods, 2011, 3(2), 452-456. [7]. A. Abbaspour; M. A. Mehrgardi; A. Noori; M.A. Kamyabi; A.Khalafi-Nezhad and M. N. Soltani Rad, Sensors and Actuators B, 2006, 113, 857-865. [8]. A. Abbaspur; E. Mirahmadi and A. Khajehzadeh, Anal. Methods, 2010, 2(3), 349–353. [9]. S. Amlathe and V. K. Gupta, Analyst, 1988, 113, 1481-1483. [10]. S. Amlathe and V. K. Gupta, Microchemical journal, 1990, 42, 331-335. [11]. K. J. Reddy; J. R. Kumar; C. Ramachandraiah; T. Thriveni and A. V. Reddy, Food Chemistry, 2007, 101(2), 585–591. [12]. G. Gumus; H. Filik; and B. Demirata, Anal. Chim. Acta, 2005, 547(1), 138–143. [13]. H. Sedaira, 2000,Talanta, 51(1), 39–48. [14]. A. Taher, Talanta, 2000, 52(2) 181–188. [15]. S.Y. Chen; C.N. Chang; C.L. Li; and S.J. J. Tsai, Anal Chim. Acta, 2005, 550(1-2), 156–163. [16]. J. Chen and K. C. Teo, Anal. Chim. Acta, 2001, 450(1-2), 215–222. [17]. N. Dallali; M.M. Zahedi and Y. Yamini, Scientia Iranica, 2007, 14, (4), 291-296. [18]. H. Shangda and S. Kunyauh, Spectrochimica Acta, 1995, 50B, 837–846. [19]. H. Minamisawa; K. Murashima; M. Minamisawa; N. Arai, and T. Okutani, Analytical Sciences, 2003, 19(3), 401–404. [20]. A. D. Eaton; L. S. Clescer and A. E. Greenberg, Standard Methods for the Examination of Water and Wastewater, 19th edition, American Public Health Association, Washington, DC, USA, 1995. [21]. J. Fang; J. P. Chen; Y. H. Shu; and H. P. Wang, Chinese Journal of Physical Testing and Chemical Analysis B, 2005, 12, 22–26. [22]. Oi-Wah Lau and Oi-Ming Cheng, Anal. Chim. Acta, 1998, 376, 197-207. [23]. L. Wei; X. Zhang; Y. Dai; J. Huang, Y.H. Xie, and Kai Xiao, Journal of Automated Methods and Management in Chemistry2008, (2008), Article ID 742319. [24]. Feigl and Anger, Spot Tests in Inorganic Analysis 6th edition, Elsevier, Amsterdam, 2005, 511. [25]. J.P.K. Adotey; J.K. Bentum; E. J. Koranteng-Addo and F.K. Baah, J. Chem. Pharm. Res., 2011, 3(3):148-153 [26]. D Sud; G Mahajan and N. P Kaur, Bioresour. Technol., 2008, 99, 6017-6027. [27]. S. M. Wanjari; Lata Deshmukh and L. J. Paliwal,J. Chem. Pharm. Res., 2012, 4(1):140-145. [28]. R. Prabakaran; S. Arivoli; M. Hema and C. Kamatchi, J. Chem. Pharm. Res., 2011, 3(5):532-543. [29]. M.M. Ambursa; U.Z.Faruk; A.Uba; D.M.Sahabi; F.A.Atiku and R.A. Koko, J. Chem. Pharm. Res., 2011, 3(6):732-741. [30]. K. L. Wasewar, IJRRAS, June 2010, 3 (3). [31]. R. Wahi; D. Kanakaraju and N.r Ashikin Yusuf, Global Journal of Environmental Research, 2010, 4 (2), 127- 134. [32]. F.D. Oliveira Requimte ; A.C. Soares , O.M. Freitas , S.A. Figueiredo, Global Nest Journal, 2010 12(2), 206- 214. [33]. R. Salim; M. Al-Subu; I. Abu-Shaqir and H. Braik, Trans I Chem E, July 2003, 81B. [34]. G. Borbely and E.Nagy, Hungarian Journal of Industrial Chemistry, VESZPREM, 2008, 36 (1-2), 17-22. [35]. J. Landaburu Aguirre; V. García; E. Pongracz; R. L. Keiski, Desalination, 2009, 240, 262-269 [36]. K. Dermentzis; A. Christoforidis; E. Valsamidou, International Journal of Environmental Sciences, 2011 1(5). [37]. J. Nouri; A. H. Mahvi and E. Bazrafshan, Int. J. Environ. Res., Spring 2010, 4(2), 201-208 [38]. G. Borbely and Endre Nagy, Desalination, 2009, 240, 218-226. [39]. S. E. Ghazy and A. H. Ragab, Latin American Applied Research, 2011, 41, 99-104. [40]. M. M. Aslam; I. Hassan; M. Malik, EJEAFChe, 2004, 3 (6), 792- 798 [41]. H. Cesur and N. Balkaya, Chemical Engineering Journal2007, 131, 203– 208. [42]. S.K. Srivastava; N. Verma; T. B. Das and Rupa Das, IJEP, 2007, 27(6) , 502-508. [43]. P. Kajitvichyanukul, and T. Sungkaratana, As. J. Energy Env., 2006, 7(01), 258-265. [44]. M. A. Atieh, 2nd International Conference on Environmental Science and Technology IPCBEE © (2011) IACSIT Press, Singapore, 2011, 6. 1104
Sulbha Amlathe et al ______________________________________________________________________________ J. Chem. Pharm. Res., 2012, 4(2):1097-1105 [45]. Fiegl and Anger, Spot test in inorganic analysis, 6th edition, Elsevier, Amsterdam, 2005, pp. 511-516. [46]. M. D. Graças; A. Korn; A. C. Ferreira; L. S. G. Teixeira, and A. C. S. Costa, J. Braz. Chem. Soc., 1999, 10(1), 46-50. [47]. J.F. van Staden and M.C. Matoetoe, Anal. Chim. Acta, 2000, 411, 201–207. [48]. C. E. Sabel; J. M. Neureuther; S. Siemann, Analytical Biochemistry, 2010, 397, 218–226. [49]. Zinc test strips,10038 EM Quant® HAZMAT UN1824 [50]. 110038 Zinc Test, Merckoquant® KGaA, Darmstadt, Germany, 2011. 1105