Download
1 / 7
70 likes | 110 Views
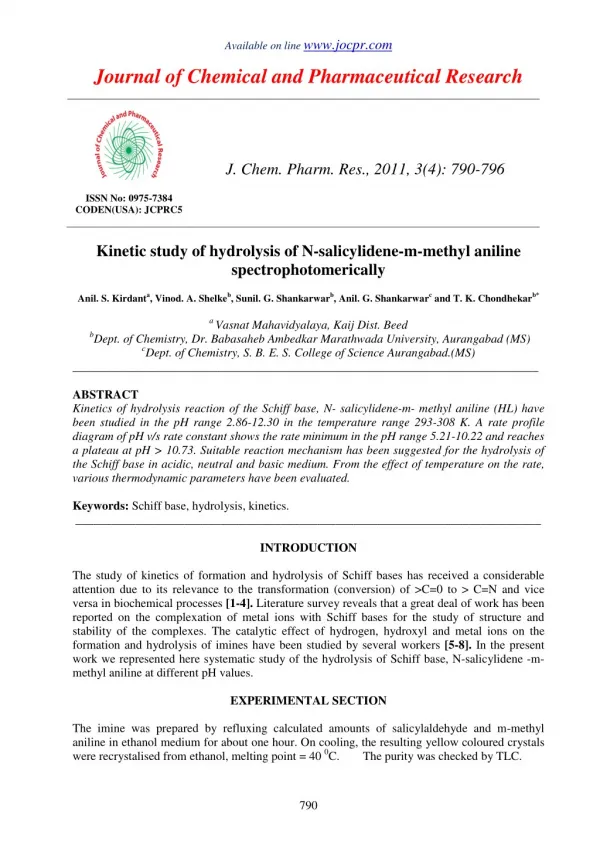
Kinetics of hydrolysis reaction of the Schiff base, N- salicylidene-m- methyl aniline (HL) have<br>been studied in the pH range 2.86-12.30 in the temperature range 293-308 K. A rate profile<br>diagram of pH v/s rate constant shows the rate minimum in the pH range 5.21-10.22 and reaches<br>a plateau at pH > 10.73. Suitable reaction mechanism has been suggested for the hydrolysis of<br>the Schiff base in acidic, neutral and basic medium. From the effect of temperature on the rate,<br>various thermodynamic parameters have been evaluated.

E N D
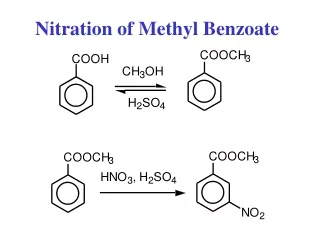
www.jocpr.com Available on line Journal of Chemical and Pharmaceutical Research J. Chem. Pharm. Res., 2011, 3(4): 790-796 ISSN No: 0975-7384 CODEN(USA): JCPRC5 Kinetic study of hydrolysis of N-salicylidene-m-methyl aniline spectrophotomerically Anil. S. Kirdanta, Vinod. A. Shelkeb, Sunil. G. Shankarwarb, Anil. G. Shankarwarc and T. K. Chondhekarb* a Vasnat Mahavidyalaya, Kaij Dist. Beed bDept. of Chemistry, Dr. Babasaheb Ambedkar Marathwada University, Aurangabad (MS) cDept. of Chemistry, S. B. E. S. College of Science Aurangabad.(MS) _____________________________________________________________________________ ABSTRACT Kinetics of hydrolysis reaction of the Schiff base, N- salicylidene-m- methyl aniline (HL) have been studied in the pH range 2.86-12.30 in the temperature range 293-308 K. A rate profile diagram of pH v/s rate constant shows the rate minimum in the pH range 5.21-10.22 and reaches a plateau at pH > 10.73. Suitable reaction mechanism has been suggested for the hydrolysis of the Schiff base in acidic, neutral and basic medium. From the effect of temperature on the rate, various thermodynamic parameters have been evaluated. Keywords: Schiff base, hydrolysis, kinetics. _____________________________________________________________________________ INTRODUCTION The study of kinetics of formation and hydrolysis of Schiff bases has received a considerable attention due to its relevance to the transformation (conversion) of >C=0 to > C=N and vice versa in biochemical processes [1-4]. Literature survey reveals that a great deal of work has been reported on the complexation of metal ions with Schiff bases for the study of structure and stability of the complexes. The catalytic effect of hydrogen, hydroxyl and metal ions on the formation and hydrolysis of imines have been studied by several workers [5-8]. In the present work we represented here systematic study of the hydrolysis of Schiff base, N-salicylidene -m- methyl aniline at different pH values. EXPERIMENTAL SECTION The imine was prepared by refluxing calculated amounts of salicylaldehyde and m-methyl aniline in ethanol medium for about one hour. On cooling, the resulting yellow coloured crystals were recrystalised from ethanol, melting point = 40 0C. The purity was checked by TLC. 790
T. K. Chondhekar et al ______________________________________________________________________________ J. Chem. Pharm. Res., 2011, 3(4):790-796 Kinetic measurements The rate of hydrolysis of was Schiff base was followed spectrophotometrically at 405 nm by using uv/vis, 1601, Shimadzu spectrophotometer. Universal buffer solutions were prepared according to the reported methods [9-10]. The pH was determined by using an Elico LI-120 pH meter. The temperature was varied between 293– 308 K. The concentration of imine was kept at 1 X 10⁻⁴ mol dm-3. The ionic strength of the reaction mixture was maintained at µ = 0.1 mol dm-3 by using KCl (E- merck). All other chemicals used were of A.R. grade (E. Merck). In a typical kinetic run, the solutions containing appropriate amounts of Schiff bases and buffer solutions were prepared at room temperature and allowed to equilibrate in previously adjusted thermostat. The quartz cuvettes were also allowed to equilibrate at the same temperature in the thermostatic cell block. After mixing, the reaction mixture was immediately transferred to a quartz cell and the decrease of absorbance of Schiff base with time was followed against the reagent blank kept in another quartz cell. The decrease of absorbance with time was followed at λ = 405 nm. Using spectrophotometer within 20 s of mixing the Schiff base. The plot of log (At-A∞) vs time were found to be straight lines and pseudo first order rate constants were calculated from the slopes. From the effect of temperature on the reaction rate, energy of activation Ea and other thermodynamic parameters were evaluated. RESULTS AND DISCUSSION The rate constant values in the pH range 2.86-12.30 at 293K are listed in Table-1. A rate profile diagram of pH v/s rate constant at 293.16 K. and ionic strength µ = 0.1 mol dm-3 shows the rate minimum at 5.21<pH < 10.22 (Fig. 1). Rate - limiting pathways In the pH range 2.86-12.30, the Schiff base (HL) may be assumed to undergo hydrolysis by four rate determining pathways3. •The acid catalysed addition of water to the imine linkage of protonated Schiff base, H2L+ (k1). •A spontaneous path involving the addition of water to the imine likage of the neutral imine, HL (k2). •The addition of water to the imine anion, L- (k3). •The addition of hydroxyl ion to the imine anion, L- (k4). The last step in which the hydroxyl ion predominates may be eliminated as the rate constant was found to be almost independent of the hydroxyl ion concentration at pH > 10.73 (Table 1). Thus the overall rate of hydrolysis will be, Rate = k1 (H2L+) + k2 (HL) + k3 (L-) The deprotonation and protonation equilibria of the imine (HL) may be represented as K1 HL H+ (1) H2L 791
T. K. Chondhekar et al ______________________________________________________________________________ J. Chem. Pharm. Res., 2011, 3(4):790-796 K2 H+ L- HL OH OH CH3 CH3 H H H H C N C N (I) (IIa) OH CH3 H C NH (IIb) OH CH3 OH CH3 H H HOH C NH C NH O (II) H H(III) -H OH OH CH3 CH3 H H H2 N H C C NH O O H H (V) (IV) CH3 OH + H H2N O C Products Scheme 1 Hydrolysis of Schiff base in acidic and neutral range of pH The rate constant varies linearly with hydrogen ion concentration in the pH range 4.51-6.61 (Table1). In this pH range, equation (1) reduces to (2), Rate = k1 (H2L+) + k2 (HL) K = (k1/K1) [H+] + k2 A plot of k vs [H+] was found to be a straight line with slope k1/K1 from which k1 was calculated to 8.13 x10⁻³ at 303K. Since the intercept of the plot is zero, k2 is taken as zero. In the acidic pH range, the proton catalysed attack of water on the reactive imine linkage of (HL) is suggested to be the rate- limiting step for the hydrolysis (scheme 1) (2) 792
T. K. Chondhekar et al ______________________________________________________________________________ J. Chem. Pharm. Res., 2011, 3(4):790-796 The extremely low rates in the neutral pH range are due to negligible protonation of (HL). Consequently, the attack of water on the protonated imine is very slow. The addition of water to the neutral imine is therefore suggested to be rate – limiting step. Hydrolysis of Schiff base in basic medium In the basic range, pH >10.42, the rate constant initially increases with increase in pH and is nearly independent of hydroxyl ion concentration at pH > 10.73 (Table 1). In this pH range, the Schiff base may be assumed to be exclusively in the anionic form L- due to the neutralization of the phenolic proton of the ortho- hydroxy group by the OH- ion of alkali [3]. The above observations lead to the assumption that the complex formed may be Arrhenius complex. In the presence of excess catalyst, Arrhenius complex leads to specific hydroxyl ion catalysis at low hydroxyl concentration and the rate reaches a limiting value at high hydroxyl ion concentration [5]. In the present study, the rate increases with the hydroxyl ion concentration at low hydroxyl ion concentrations. Table: 1 Rate constant data for hydrolysis of N- salicylidene –m- methyl aniline. Ethanol – water = 40 % (v/v), Temp. = 293K, µ = 0.1 mol dm-3. pH [H+] x 106 mol dm-3 2.86 13800.00 3.16 6918.00 4.51 2630.00 5.21 61.66 6.61 1.95 8.40 10.22 1660.00 10.42 2630.00 10.73 5370.00 11.15 14130.00 12.30 19250.00 [OH-] x 106 mol dm-3 2.53 k x 103 S-1 55.10 30.64 2.18 1.24 1.14 1.06 1.05 7.20 11.80 12.72 14.24 k x 103 versus pH 60 k x 103 s-1 30 0 2 9 16 pH Figure: 1 Plot of k against pH at 303K for the hydrolysis of N-salicylidene -m -methyl aniline at µ µ µ µ = 0.1 mol dm-3. 793
T. K. Chondhekar et al ______________________________________________________________________________ J. Chem. Pharm. Res., 2011, 3(4):790-796 Further the rate reaches a limiting value at higher hydroxyl ion concentrations. All these facts indicate that the rate- limiting step is the slow reactions of Schiff base anion L- water (k4)3[6]. The average value of the rate constants at pH > 10.73 is taken as k4 = 12.4 x 10⁻³ at 303 K. Table: 2 Rate constant (order) data of hydrolysis of N-salicylidene-m-methyl aniline Medium-(ethanol - water) Temp. = 30 0C Buffer- Acetate [SB] = A2 Time O.D. A0-A∞ At-A∞ Log( A0-A∞/At- A∞) k x 102 s-1 0 0.033 15 0.028 0.014 0.009 30 0.025 0.014 0.006 45 0.023 0.014 0.004 60 0.021 0.014 0.002 75 0.020 0.014 0.001 ∞ 0.019 pH = 3.16 µ = 0.1 M 0.1919 0.3679 0.5441 0.8451 1.1461 kmean k Graph 2.946 2.825 2.784 3.244 3.519 3.064 3.362 Time vs Log (A0-A∞)/(At-A∞) 1.6 y = 0.0146x R2 = 0.9898 1.2 Log (A0 - A∞ )/(At-A∞) 0.8 0.4 0 0 20 40 60 80 Time in sec. Figure:2 (a) Plot of Time versus Log ( A0-A∞/At- A∞) at 30 0C for the hydrolysis of N-salicylidene -m -methyl aniline at pH = 3.16 Time versus Log(At- A∞) 0.5 y = -0.0159x - 1.7822 R2 = 0.9918 -0.5 Log (At-A∞) -1.5 -2.5 -3.5 0 20 40 60 80 Time in sec. Figure:2 (b) Plot of Time versus Log (At- A∞) at 30 0C For hydrolysis of N-salicylidene -m -methyl aniline at pH = 3.16 794
T. K. Chondhekar et al ______________________________________________________________________________ J. Chem. Pharm. Res., 2011, 3(4):790-796 Effect of temperature and thermodynamic parameters The hydrolysis of Schiff base was carried out at four different temperatures 293,298,303, 308 K. From, the effect of temperature on the reaction rate the various thermodynamic parameters like energy of activation Ea, ∆H≠, ∆G≠ and ∆S≠ were evaluated are given in the table- II. The plot of (3 + log k) v/s 1/T is linear (Fig.-II) for the hydrolysis of N-salicylidene -m -methyl aniline. The negative ∆S≠ value obtained can perhaps be explained by a model in which water molecules are tightly held to the imine linkage, the nucleus of the hydrolytic reaction [11-13]. The large negative values observed may an extensive reorientation of solvent molecules as a result of the formation of the activated complex. Table: 3 Rate constants and activation parameters for N-salicylidene -p -chloro aniline Temperature 103 x k s-1 cal mol-1 cal mol-1 293 K 1.883 298 K 2.324 303 K 3.050 9501.28 -40.745 308 K 4.149 ∆S≠ ∆G≠ cal mol-1 21034.69 8908.836 5.9497 ∆H≠ cal mol-1 Ea Log A 1/T versus ( 3+log k ) y = -1690.8x + 5.9497 R2 = 0.9927 0.6 0.4 (3 + logk ) 0.2 0 0.0032 0.00325 0.0033 0.00335 0.0034 0.00345 1/T Figure: 3 (a). Plot of (3+ log k) against 1/T for the hydrolysis of N-salicylidene -m -methyl aniline. Time vs Log (A0-A∞)/(At-A∞) 2 1.5 Log (A0 - A∞ )/(At-A∞) 1 0.5 0 0 5 10 15 20 25 30 Time in min. Figure: 3 (b) Plot of log (A0-A∞)/ (At-A∞) against Time REFERENCES [1]AV WilliHelv. Chem. Acta., 1956, 39, 1193. [2]MTA Behme; EH Cordes. J. Am. Chem. Soc.,1965, 87, 260. 795
T. K. Chondhekar et al ______________________________________________________________________________ J. Chem. Pharm. Res., 2011, 3(4):790-796 [3]RL Reeves. J. Org. Chem.,1965, 30, 3129. [4]L Doamaral; WA Sandstorm and EH Cordes .J. Am. Chem. Soc., 1966, 88, 2225. [5]AC Dash; B Dash and PK Mohapatra. J. Chem. Soci. Dalton Trans., 1983, 1503, 1505. [6]DV Prabhu and NB Laxmeshwar. J. Indian Chem. Soc., 1989, 66, 879. [7]FA Adam; MT ElHaty and SA El Gyar. J. Indian Chem., Soc.,1988, 65, 37. [8]KJ Laidler. Chemical Kinetic; 2nd ed., Tata Mc. Graw-Hill, New Delhi, 1978, 459-463. [9]GL Eichhorn and IM Trachtenberg. J. Am. Chem. Soc.,1954, 76, 5183. [10]HTS Britton, Hydrogen Ions; Chapman and Hall. London1958. [11]K Gangawani; PK Sharma and KK Banerji. J. Indian Chem. Soc.2000, 39A, 436. [12]RA Mane, BH Zaware and DB Ingle. J. Indian Chem. Soc.2000, 77, 214. [13]AS Kirdant, SG Shankarwar and TK Chondhekar. Int. J. Chem. Sci., 2010, 8(1),279. 796