Download
1 / 9
90 likes | 174 Views
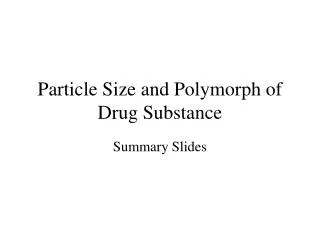
In pharmaceutical development, we encounter amorphous and disordered crystalline materialsin a number of ways<br>like milling, wet granulation, drying and re-crystallization. From a pharmaceutical perspective, whenever<br>amorphous material is present there must be a significant concern since, relative to the crystalline state, the<br>amorphous state is less thermodynamically stable. As per regulatory requirements the amorphous phase generated<br>may need to be quantified by using sensitive analytical tools. In the present study, amorphous content in crystalline<br>form of Cefuroxime axetil drug substance was studied by different analytical techniques like Modulated Differential<br>Scanning Calorimetry (MDSC) and Powder X-Ray Diffraction (PXRD).

E N D
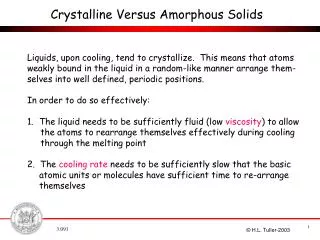
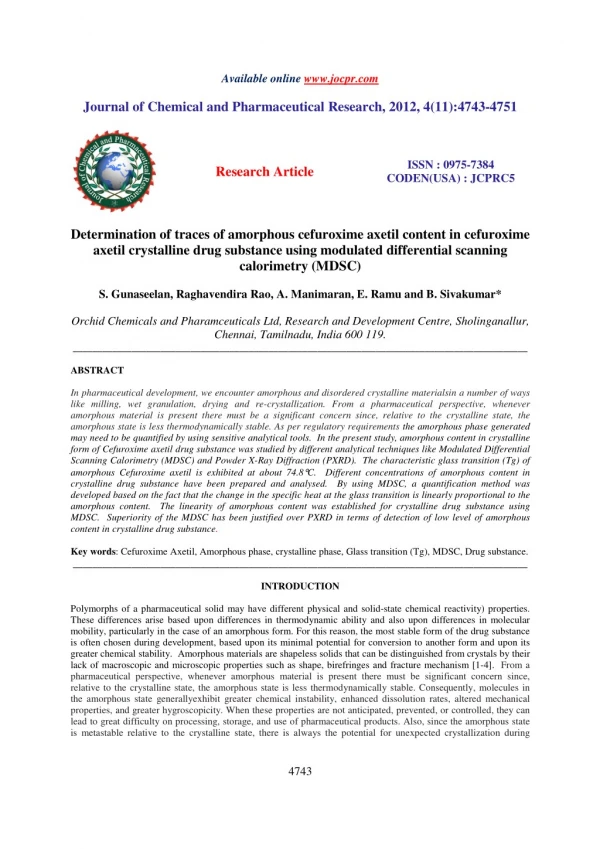
Available online www.jocpr.com Journal of Chemical and Pharmaceutical Research, 2012, 4(11):4743-4751 ISSN : 0975-7384 CODEN(USA) : JCPRC5 Research Article Determination of traces of amorphous cefuroxime axetil content in cefuroxime axetil crystalline drug substance using modulated differential scanning calorimetry (MDSC) S. Gunaseelan, Raghavendira Rao, A. Manimaran, E. Ramu and B. Sivakumar* Orchid Chemicals and Pharamceuticals Ltd, Research and Development Centre, Sholinganallur, Chennai, Tamilnadu, India 600 119. _____________________________________________________________________________________________ ABSTRACT In pharmaceutical development, we encounter amorphous and disordered crystalline materialsin a number of ways like milling, wet granulation, drying and re-crystallization. From a pharmaceutical perspective, whenever amorphous material is present there must be a significant concern since, relative to the crystalline state, the amorphous state is less thermodynamically stable. As per regulatory requirements the amorphous phase generated may need to be quantified by using sensitive analytical tools. In the present study, amorphous content in crystalline form of Cefuroxime axetil drug substance was studied by different analytical techniques like Modulated Differential Scanning Calorimetry (MDSC) and Powder X-Ray Diffraction (PXRD). The characteristic glass transition (Tg) of amorphous Cefuroxime axetil is exhibited at about 74.8°C. Different concentrations of amorphous content in crystalline drug substance have been prepared and analysed. By using MDSC, a quantification method was developed based on the fact that the change in the specific heat at the glass transition is linearly proportional to the amorphous content. The linearity of amorphous content was established for crystalline drug substance using MDSC. Superiority of the MDSC has been justified over PXRD in terms of detection of low level of amorphous content in crystalline drug substance. Key words: Cefuroxime Axetil, Amorphous phase, crystalline phase, Glass transition (Tg), MDSC, Drug substance. _____________________________________________________________________________________________ INTRODUCTION Polymorphs of a pharmaceutical solid may have different physical and solid-state chemical reactivity) properties. These differences arise based upon differences in thermodynamic ability and also upon differences in molecular mobility, particularly in the case of an amorphous form. For this reason, the most stable form of the drug substance is often chosen during development, based upon its minimal potential for conversion to another form and upon its greater chemical stability. Amorphous materials are shapeless solids that can be distinguished from crystals by their lack of macroscopic and microscopic properties such as shape, birefringes and fracture mechanism [1-4]. From a pharmaceutical perspective, whenever amorphous material is present there must be significant concern since, relative to the crystalline state, the amorphous state is less thermodynamically stable. Consequently, molecules in the amorphous state generallyexhibit greater chemical instability, enhanced dissolution rates, altered mechanical properties, and greater hygroscopicity. When these properties are not anticipated, prevented, or controlled, they can lead to great difficulty on processing, storage, and use of pharmaceutical products. Also, since the amorphous state is metastable relative to the crystalline state, there is always the potential for unexpected crystallization during 4743
B. Sivakumar et al ______________________________________________________________________________ J. Chem. Pharm. Res., 2012, 4(11):4743-4751 storage, leading to macroscopic changes in specific surface area, flow, and concretion. As the amorphous materials acts as a contaminant, it is often necessary to quantify and determine its concentration in crystalline samples. From Regulatory perspectives, clear understanding of the polymorphism and its impact on drug product is essential in demonstrating consideration of polymorphism in the determination of drug substance ‘‘sameness’.[1-9] Differential scanning calorimetry (DSC) is widely used for drug polymorphism studies, mainly as a qualitative tool. There are, however, some limits to the usefulness of DSC when studying the polymorphic behavior of some compounds. The thermal characterization of the lower melting polymorphs of a compound is a common problem. On heating at standard heating rates such species may exhibit multiple thermal events due to concurrent recrystallization to an alternative crystal form and subsequent melting of this new form [10]. Hence determination of the polymorphic purity of such species by DSC can be problematic. Further, for a polymorph that undergoes concurrent recrystallization during melting, it is not possible to accurately determine from a single transition the thermodynamic parameters, such as the enthalpy of fusion, associated with this event.The presence of amorphous phase is distinctly seen as a glass transition endotherm, although this might be difficult to observe for low levels of amorphous state. Conventional DSC will give only total heat flow or average heat flow it can’t separate the reversing heat flow & no reversing heat flow from total heat flow and thus relatively lesser sensitive for detection of weak transition, But MDSC can play a very important role in detection of amorphous content in DSC and can also be determined directly from the change of Specific cheat capacity (Cp) at glass transition. MDSC can show glass transitions with much increased sensitivity.[11,12] The scope of the present study was to demonstrate the application of MDSC in the detection of low level amorphous content in Cefuroxime axetil Crystalline samples by comparative evaluation of PXRD. EXPERIMENTAL SECTION Cefuroxime axetil (1-Acetoxyethyl (6R,7R)-3-[(carbamoyloxy) methyl]-7-{[(2Z)-2-(2-furyl)-2-(methoxy imino) acetyl]amino}-8-oxo-5-thia-1-azabicyclo[4.2.0]oct-2-ene-2-carboxylate) is a second generation oral cephalosporin antibiotic discovered by Glaxo. It is an acetoxyethyl ester prodrug of cefuroxime which is effective orally. Its molecular formula is C20H22N4O10S, and it has a molecular weight of 510.48. [10,11] Cefuroxime axetil is in the amorphous form and has the following structural formula: O C H3 * CH3 O O O O O O N O NH2 O N HH S N H and epimer at C* O H3 C Molecular Formula : C20 H22N4O10S Molecular Weight : 510.47 Figure 1: Chemical structure of Cefuroxime Axetil Amorphous sample preparation: Cefuroxime axetil amorphous samples were prepared by spray drying of crystalline samples. Sample analysis: Weighed the required quantity of amorphous and crystalline material and blended in different proportions and ground gently to ensure uniform mix and took ~10 mg of blend sample into the aluminium crucible (40 ul), covered with lid and crimped the sample. 4744
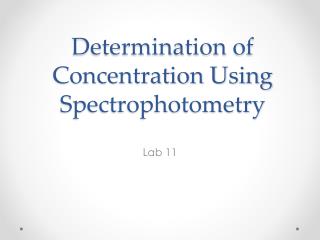
B. Sivakumar et al ______________________________________________________________________________ J. Chem. Pharm. Res., 2012, 4(11):4743-4751 Different levels of concentrations have been prepared by spiking the two different components at various levels and plotted a linearity graph. POWDER X-RAY DIFFRACTION (PXRD): The X-ray powder diffraction pattern was reported on Bruker AXS D8 ADVANCE, equipped with Bragg-Brentano goniometer having PSD; LynxEye detector. The pattern was recorded at a tube voltage of 40 kV and a tube current of 30 mA, with a step size of 0.02°?and time per step of 1.0 sec over an angular range of 3-45°? 2θ. The sample was grounded gently and filled in a sample holder by top loading method. The sample was exposed to the CuKλ radiations (λ = 1.5418 °A) MODULATED DIFFERENTIAL SCANNING CALORIMETRY (MDSC): The thermal analysis was carried out on DSC, TA Q1000. The thermogram was recorded from -20°C to 90°C under the nitrogen flow of 50 mL/min at a heating rate of 10°C per minute with a modulation temperature of 1°C per min. Weighed about 15 mg sample into aluminum pan and distributed uniformly as a thin layer. The glass transition was recorded as the inflection point up to the step changed base line. The heat flow was calibrated by enthalpy of indium (28.51J/g) or by the specific heat capacity of Sapphire. The specific heat method used the specific heat of sapphire over a user-defined temperature range. The baseline and sample curves were measured and the calibration was then built automatically. The calibration was checked before running samples by measuring the melting enthalpy of Indium by using the same instrumental parameters. RESULTS AND DISCUSSION Pure crystalline and amorphous forms were characterized by PXRD and DSC as shown in Figure 1 & 2. In PXRD Pure crystalline form was characterized with high intensity characteristic peaks with a stable baseline. DSC data of crystalline form was shown in Figure-2 indicating a melting at around 86°C. Figure 2: PXRD of Crystalline and Amorphous forms of Cefuroxime Axetil Pure amorphous form shows a halo and is free from any type of crystalline peak by PXRD and shows a glass transition by MDSC at about 74.8°C. The crystalline sample didn’t have any thermal even that corresponds to glass transition suggesting that the sample was free from any amorphous impurity. Also the amorphous form generated was chemically pure (~99% using HPLC Related substance method). 4745
B. Sivakumar et al ______________________________________________________________________________ J. Chem. Pharm. Res., 2012, 4(11):4743-4751 Figure 3: DSC of Crystalline and Amorphous forms of Cefuroxime Axetil Figure 4: MDSC thermogram of Amorphous and Crystalline form In amorphous compounds processing can result in internal molecular stresses (thermal history effects) which are relieved on heating. The release of these stresses sometimes appears as a small endothermic relaxation even after 4746
B. Sivakumar et al ______________________________________________________________________________ J. Chem. Pharm. Res., 2012, 4(11):4743-4751 the glass transition. A small endotherm appears in the DSC of amorphous Cefuroxime axetil at around 80°C is due to enthalpy relaxation [15,16] The amorphous content in any crystalline sample can be assessed using PXRD after spiking of amorphous fraction (if the sample is crystalline) or without spiking (if the sample is semi crystalline or poorly crystalline and consists of crystalline and amorphous fractions co-existing). By PXRD the degree of crystallinity (and hence the amorphous content) can be roughly estimated by calculating the total area (crystalline + Amorphous) and the crystalline area by using the formula shown below, % crystallinity = 100A / (A+B-C) Where A = total area of the peaks arising from diffraction from the crystalline fraction of the sample B = total area below area A (Amorphous background) C=background area (due to air scattering, fluorescence, equipment, etc.,). Figure 5: PXRD of Cefuroxime crystalline samples spiked with amorphous material at 10%, 20%, 30% 40% , 50% and 100% level. Modulated DSC offers all the benefits of standard DSC, overcomes its limitations, and provides further information for greater understanding of material properties. Specifically, MDSC permits separation of the total heat flow signal into its thermodynamic (heat capacity) and kinetic components. The reversing heat flow signal, which is the heat capacity component of the total signal (glass transition and melting) is extremely useful for measuring glass transition in all types of difficult samples. MDSC offers simultaneous improvements in sensitivity and resolution, and can separate overlapping events that are difficult or impossible to do by standard DSC. MDSC can play a very important role in detection of amorphous content in DSC and can also be determined directly from the change of heat capacity (Cp) at glass transition. MDSC can show glass transitions with much increased sensitivity. The degree of amorphous content in Cefuroxime axetil crystalline samples was determined using both PXRD and MDSC and the below discussion cover a comparative assessment of relative superiority of one method over the other. [19] 4747
B. Sivakumar et al ______________________________________________________________________________ J. Chem. Pharm. Res., 2012, 4(11):4743-4751 Figure 6: Overlaid thermograms for different concentrations shows the glass transition TG Figure 7: Linearity between the concentrations at various levels Vs Heat Capacity at Tg PXRD could quantify amorphous phase in crystalline phase only at around 10-20% in the case of Cefuroxime Axetil. This may be due to the interference of well crystalline peaks which suppress the halo background in the diffractogram at very small levels of amorphous fraction in the sample, In this case it is difficult to consider the actual hallow due to amorphous content in these samples. Even in 1:1 mixture of amorphous and crystalline, it is very difficult to quantify the individual forms as evident from Figure 5. MDSC on the other hand, could identify low level of amorphous content in crystalline phase due to the sensitivity of glass transition (Tg) event as observed in our study. Different concentration (1%, 2.5%, 5%, 7.5% and 10%) of amorphous form in crystalline form was prepared and analysed by MDSC. Figure 6 shows the different amorphous content ranging from 1-10%. The linearity graph (Figure 7) was plotted for various concentrations (%w/w) of amorphous in crystalline form against the Heat Capacity. From the linearity results MDSC can be 4748
B. Sivakumar et al ______________________________________________________________________________ J. Chem. Pharm. Res., 2012, 4(11):4743-4751 effectively used for quantification of amorphous fraction at low level (up to 1%) with a correlation coefficient (>0.99) (Figure 6 and 7 and Table 1). It is noteworthy that this method does not yield absolute degree of crystallinity values and hence is generally used for comparative purpose only [17-18]. Table 1: Linearity Regression Statistics Cefuroxime Axetil amorphous content in Crystalline - Linearity S.No Conc of Amorphous content (%) Linearity 1 1.00 Linearity 2 2.50 Linearity 3 5.00 Linearity 4 7.50 Linearity 5 10.00 Slope STEYX Intercept Correlation coefficient The Limit of Detection (LOD) of Cefuroxime axetil amorphous in Crystalline drug substancewas determined as 1% during method development and the LOD level precision at the given concentration (1% ) was established by spiking the amorphous form in crystalline form. From the Heat Capacity calculated in the MDSC analysis the precision was calculated. The result is shown in Table IIanda representative thermogram at the LOD concentration is shown in Figure 8. The Limit of Quantitation (LOQ) of Amorphous Form in crystalline Form drug substance was evaluated by spiking amorphous Form at double the concentration of LOD value (1%). Fromthe Heat capacity data obtained from the MDSC result the precision was calculated. The result is shown in Table III anda representative thermogram at the LOQ concentration (2%) is shown in Figure 9. (Acceptance Criterion: % RSD should be not more than 10). Figure 8: Precision at LOD level (1%) Heat capacity(J/g°C) 0.005604 0.01574 0.02848 0.04998 0.06988 0.0071 0.002800 -0.003 0.9958 4749
B. Sivakumar et al ______________________________________________________________________________ J. Chem. Pharm. Res., 2012, 4(11):4743-4751 Table II: LOD Regression Statistics Cefuroxime Axetil - LOD S.No Heat capacity(J/g°C) 1 2 3 4 5 6 Average STDEV %RSD (Acceptance Criterion: % RSD should be not more than 33). 0.006535 0.005847 0.005646 0.007060 0.006039 0.004837 0.005994 0.00076 12.68 Figure 9: Precision at LOQ level (2%) Table III:Regression Statistics- LOQ Cefuroxime Axetil - LOQ S.No Heat capacity(J/g°C) 1 2 3 4 5 6 Average STDEV %RSD (Acceptance Criterion: % RSD should be not more than 33). 0.01194 0.01218 0.01372 0.01130 0.01396 0.01297 0.012680 0.00105 8.28 CONCLUSION The utility of analytical techniques like PXRD and MDSC was evaluated for the qualitative and quantitative estimation of Cefuroxime Axetil amorphous content in Cefuroxime axeti crystalline drug substance. Based on the study, it can be concluded that MDC is the best technique to find out the lower level of amorphous form contamination around 1% levels in crystalline form. 4750
B. Sivakumar et al ______________________________________________________________________________ J. Chem. Pharm. Res., 2012, 4(11):4743-4751 Acknowledgement Authors would like to thank Dr. U. P. Senthilkumar and Mr. S. Murugan, Head-ARD and ARD colleagues for support and encouragement. REFERENCES [1]X-ray diffraction of pharmaceutical materials.Harry G HG Brittain, inAnalytical Profiles of Drug Substances, 2003, 30, 334. [2]Brittain HG, editor, Physical characterization of amorphous solids, New York, 1995, MorcellDekkar, Inc. [3]Solid State Chemistry of Drugs, S.R.Byrn, R.R. Pfeiffer, J.G. Stowell-2nd ed.,1999, 249-258 [4]Cheng, Yang Tse and William L. Johnson Science,1997, 235, 997-1002. [5]G. Saurabh, C. Kaushal, J. Chem. Pharm. Res., 2011, 3(3):6-17. [6]A strategic approach to Regulatory considerations. Review: Pharmaceutical Research, 1995, Vol.12, No.7. [7]K. Rajarajeswari, K. Abdulla and M. Sudhakar, J. Chem. Pharm. Res., 2011, 3(1):180-187. [8]B. Sivakumar, K. Suresh Kumar, S. Mohan and U. P. Senthilkumar, J. Chem. Pharm. Res.,2012,4(10):4589- 4596. [9]Rajender Guleria1, N.S.Kaith, Ranjit SingJ. Chem. Pharm. Res., 2011, 3(6):655-664. [10]Verdonck, E., Schaap, K., Thomas, L.C., Int. J. Pharm. 1999, 192, 3–20 [11]D. M. Raut, D. M. Sakharkar, P. S. Bodeke, D. T. Mahajan, Der Pharmacia Lettere, 2011: 3 (4) 1-12. [12]N. Fagegaltier 1, A. Lamure, C. Lacabanne, A. Caron, H. Mifsud and M. Bauer, Journal of Thermal Analysis, 1997, 48, 459-464. [13]Ceftin:http://www.rxlist.com/ceftin-drug.htm [14]Cefuroxime axetil: an updated review of its use in the management of bacterial infections. Scott LJ, Ormrod D, Goa KL, Drugs.2001, 61(10), 1455-500. [15] S.L. Shamblin and G. Zografi, Pharm. Research, 1998, 15 (12), 1829. [16] DSC 2920 Differential Scanning Calorimeter Operator’s manual, TA Instruments, 1998, C-62. [17]Peter Varlaskin, Approaches to Quantification of Amorphous Content in Crystalline Drug Substance by Powder X-ray Diffraction, American Pharmaceutical Review, 2011 [18]Characterization of Crystalline and Partially crystalline solids by X-ray Powder Diffraction (XRPD), European Pharmacopeia, 2010,7.0, 301 [19] Detection and Quantification of Amorphous Content in Pharmaceutical Materials, Steven R. Aubuchon and Leonard C. Thomas, TA application notes. 4751