Download
1 / 4
40 likes | 79 Views
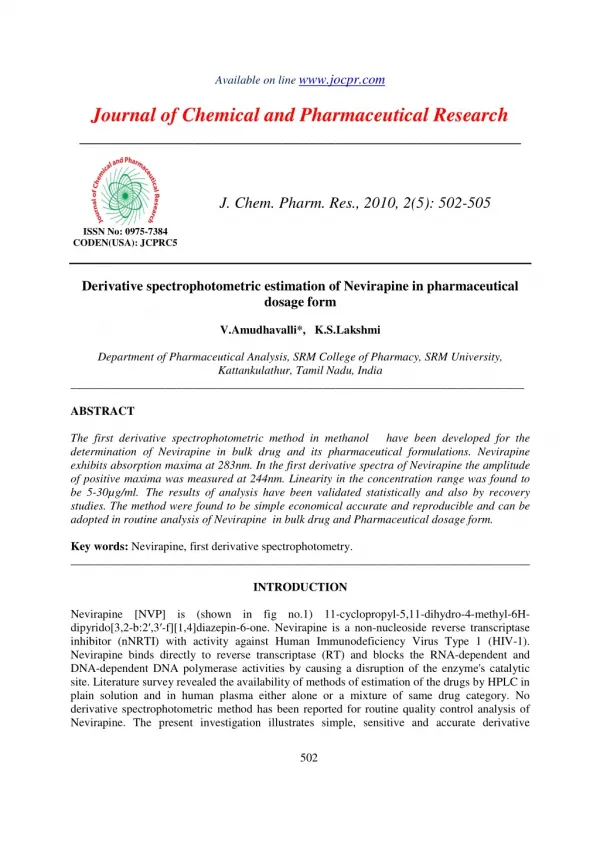
The first derivative spectrophotometric method in methanol have been developed for the determination of Nevirapine in bulk drug and its pharmaceutical formulations. Nevirapine exhibits absorption maxima at 283nm. In the first derivative spectra of Nevirapine the amplitude of positive maxima was measured at 244nm. Linearity in the concentration range was found to be 5-30µg/ml. The results of analysis have been validated statistically and also by recovery studies. The method were found to be simple economical accurate and reproducible and can be adopted in routine analysis of Nevirapine in bulk drug and Pharmaceutical dosage form. <br>

E N D
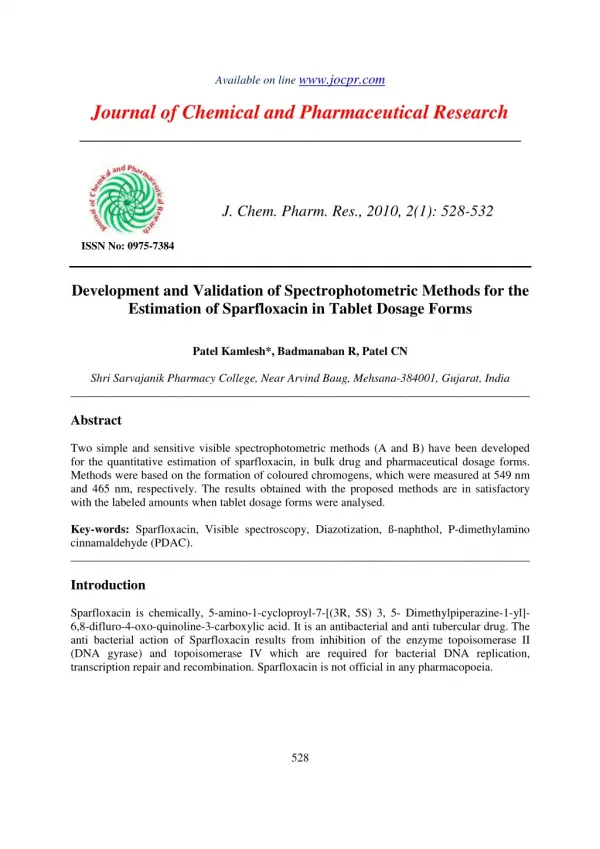
Available on line www.jocpr.com Journal of Chemical and Pharmaceutical Research __________________________________________________ J. Chem. Pharm. Res., 2010, 2(5): 502-505 ISSN No: 0975-7384 CODEN(USA): JCPRC5 Derivative spectrophotometric estimation of Nevirapine in pharmaceutical dosage form V.Amudhavalli*, K.S.Lakshmi Department of Pharmaceutical Analysis, SRM College of Pharmacy, SRM University, Kattankulathur, Tamil Nadu, India _____________________________________________________________________________ ABSTRACT The first derivative spectrophotometric method in methanol have been developed for the determination of Nevirapine in bulk drug and its pharmaceutical formulations. Nevirapine exhibits absorption maxima at 283nm. In the first derivative spectra of Nevirapine the amplitude of positive maxima was measured at 244nm. Linearity in the concentration range was found to be 5-30µg/ml.The results of analysis have been validated statistically and also by recovery studies. The method were found to be simple economical accurate and reproducible and can be adopted in routine analysis of Nevirapine in bulk drug and Pharmaceutical dosage form. Key words: Nevirapine, first derivative spectrophotometry. ______________________________________________________________________________ INTRODUCTION Nevirapine [NVP] is (shown in fig no.1) 11-cyclopropyl-5,11-dihydro-4-methyl-6H- dipyrido[3,2-b:2′,3′-f][1,4]diazepin-6-one. Nevirapine is a non-nucleoside reverse transcriptase inhibitor (nNRTI) with activity against Human Immunodeficiency Virus Type 1 (HIV-1). Nevirapine binds directly to reverse transcriptase (RT) and blocks the RNA-dependent and DNA-dependent DNA polymerase activities by causing a disruption of the enzyme's catalytic site. Literature survey revealed the availability of methods of estimation of the drugs by HPLC in plain solution and in human plasma either alone or a mixture of same drug category. No derivative spectrophotometric method has been reported for routine quality control analysis of Nevirapine. The present investigation illustrates simple, sensitive and accurate derivative 502
V.Amudhavalli et al J. Chem. Pharm. Res., 2010, 2(5): 502-502 ___________________________________________________________________________ spectrophotometric method for the analysis of Nevirapine in bulk drug and Pharmaceutical formulations . Fig No.1 Nevirapine EXPERIMENTAL SECTION Materials and methods Materials and Reagents: Nevirapine obtained from Hetero Pharmaceuticals Ltd., Hyderabad, India. Methanol was used for the analysis having AR grade. Instrumentation A Perkin-Elmer UV-Visible double beam spectrophotometer (lamda-25) with 1cm matched quartz cell was used to measure absorbance of the resulting solution. Preparation of stock solution and sample solution Stock solution of Nevirapine (1mg/ml) was prepared separately by dissolving in methanol and having a concentration of 100 µg/ml. The prepared stock solution was stable in methanol at room temperature for 6 days . In first derivative spectrum, aliquots of working solution of NVP, 100 µg/ml was taken separately from which 0.5 to 3.0 ml were transferred into a series of 10ml volumetric flasks and made up to the mark with methanol. The amplitude of positive maximum adjacent to 244nm was measured for NVP. Nevirapine tablets containing 200 mg NVP were analysed by the proposed method. For the analysis of pharmaceutical formulations, Ten tablets NVP were weighed and powdered seperately. A quantity equivalent to labeled amount was weighed and transferred into conical flask and extracted with methanol by magnetic stirrer for about 30 minutes, then it was filtered through whatman filter paper no.41 into a calibrated 10ml volumetric flask. Filter paper was rinsed twice with 1ml each of methanol and was made upto 10ml with methanol. Appropriate aliquots was then taken in such a way that the final concentration in 10ml volumetric flask were with in the range used for testing the drug . The recovery studies were carried out by adding known amount of standard solution of NVP to preanalysed tablet solutions individually. The resulting solutions were then analysed by proposed method. The results of recovery studies were found to be satisfactory. 503
V.Amudhavalli et al J. Chem. Pharm. Res., 2010, 2(5): 502-502 ___________________________________________________________________________ RESULTS AND DISCUSSION The optical characteristics such as Beers’ law limit, molar extinction coefficient, LOD, LOQ, percent relative standard deviation and percentage range of error at 95% confident limit of all the methods were incorporated in Table 1 Table 1: Optical characteristics, precision and accuracy of Nevirapine (NVP) S.No Parameters 1 Absorption Maxima (nm) 2 Linearity range (µg/ml) 3 Molar Absorptivity (Lit/mol/cm) 4 Correlation Coefficient (r) 5 Slope (B) 6 Intercept (A) 7 Interday Precision 8 Intraday Precision 9 LOD(µg/ml) 10 LOQ(µg/ml) The intraday and interday relative standard deviation values and also low RSD values obtained from the analysis of pharmaceutical formulations indicated that intermediate precision of method was good To validate the prediction ability of the suggested methods, the different concentrations of NVP in laboratory sample were analysed. The satisfactory result was obtained for all the method (Table 2). Table 2: Analysis of marketed formulations Methods Label claim (mg) estimated (mg) NVP [Viramune] Linearity of Nevirapine Using standard addition technique, the validity of the methods was further confirmed, the standard addition technique was carried out by spiking placebo (starch, lactose and magnesium stearate) with addition of NVP at 50%, 100%, and 150% respectively in the sample solution. The NVP 244 5-30 1.33x10⁻¹ 0.9995 2.2214 -0.75 0.7-1.2% 1.0-1.8% 0.3578 1.664 Amount %RSD Standard deviation % recovered 200 201.9 0.031 0.031 100.2 Linearity of Nevirapine- lderiv 80 70 60 50 am plitude 40 series 1 Linear (series 1) 30 20 10 0 0 20 40 -10 concentration 504
V.Amudhavalli et al J. Chem. Pharm. Res., 2010, 2(5): 502-502 ___________________________________________________________________________ percentage recoveries of the three concentrations were found to be close to 100%. This implies the high percentage recoveries and no interference from excipients and ingredients. In the first derivative spectra, good amplitude was observed and therefore, derivative spectroscopy methods was selected for analysis CONCLUSION The proposed method was found to be simple, precise, accurate and rapid for determination of Nevirapine from pure and pharmaceutical formulations. All the proposed methods produce comparable results and can be used for precise and accurate analysis of NVP in its pure and in Tablet dosage forms. Interference studies revealed that the common excipients and other additivies usually present in the dosage form did not interfere in the method. The values of standard deviation were satisfactory and percentage recovery was close to 100% indicating the reproducibility and accuracy of the methods can be employed as a quality control tool for the analysis of Nevirapine in combined dosage forms. Acknowledgement The authors are grateful to the Management of SRM College Of Pharmacy, Kattankulathur for their continous support and encouragement and for providing the necessary facilities. REFERENCES [1] N.Stieger,W.Liebenberg, JC.Wessels. Pharmazie. 2009, 64(10),690-1. [2] M.Sarkar, S.Khandavilli , R.Panchagnula. J Chromatogr B Analyt Technol Biomed Life Sci. 2006, 830(2), 349-54. [3] C.J.Bennetto., J.R.King.,M.L.Turner., J.S.A.Stringer and E.P. Acosta., Clin.Chem., 2004, 50, 209-211. [4] P.Langmann., D.Schirmer., T.Vath., S.Desch., M.Zilly and H.Klinker., J. Chromatogr. B. Analyt.Technol. Biomed. Life. Sci , 2002, 767, 69-74. [5] R.M. Lopez., L.Pou., M.R.Gomez., I.Ruiz and J.Monterde J.Chromatogr. B. Biomed. Sci. and Appl.,2001, 751, 371-376. [6] A. Checa , R.Oliver , J.Saurina , S.Hernández-Cassou . Anal Chim Acta. 2006 , 572(1),155- 64. 505