Download
1 / 12
120 likes | 143 Views
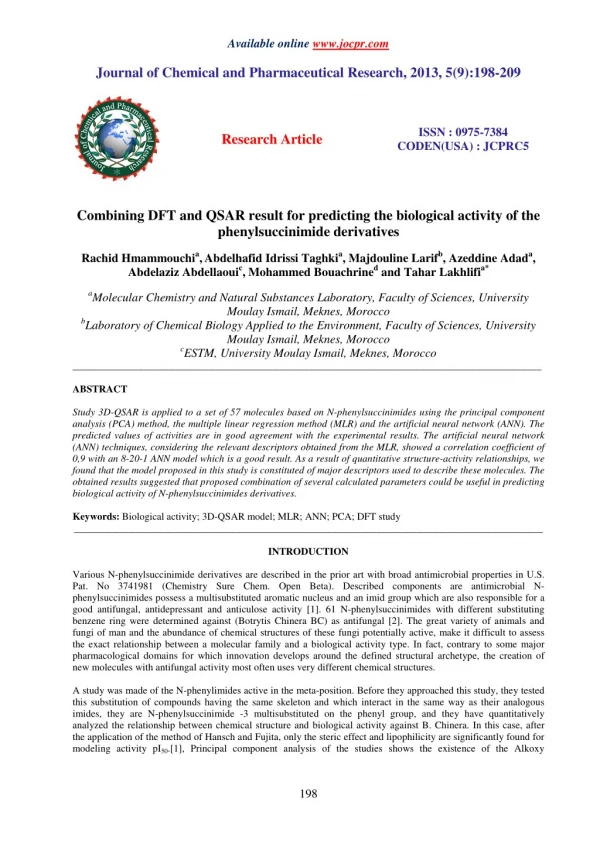
Study 3D-QSAR is applied to a set of 57 molecules based on N-phenylsuccinimides using the principal component<br>analysis (PCA) method, the multiple linear regression method (MLR) and the artificial neural network (ANN). The<br>predicted values of activities are in good agreement with the experimental results. The artificial neural network<br>(ANN) techniques, considering the relevant descriptors obtained from the MLR, showed a correlation coefficient of<br>0,9 with an 8-20-1 ANN model which is a good result. As a result of quantitative structure-activity relationships, we<br>found that the model proposed in this study is constituted of major descriptors used to describe these molecules. The<br>obtained results suggested that proposed combination of several calculated parameters could be useful in predicting<br>biological activity of N-phenylsuccinimides derivatives.

E N D
Available online www.jocpr.com Journal of Chemical and Pharmaceutical Research, 2013, 5(9):198-209 ISSN : 0975-7384 CODEN(USA) : JCPRC5 Research Article Combining DFT and QSAR result for predicting the biological activity of the phenylsuccinimide derivatives Rachid Hmammouchia,Abdelhafid Idrissi Taghkia, Majdouline Larifb, Azeddine Adada, Abdelaziz Abdellaouic, Mohammed Bouachrined and Tahar Lakhlifia* aMolecular Chemistry and Natural Substances Laboratory, Faculty of Sciences, University Moulay Ismail, Meknes, Morocco bLaboratory of Chemical Biology Applied to the Environment, Faculty of Sciences, University Moulay Ismail, Meknes, Morocco cESTM, University Moulay Ismail, Meknes, Morocco _____________________________________________________________________________________________ ABSTRACT Study 3D-QSAR is applied to a set of 57 molecules based on N-phenylsuccinimides using the principal component analysis (PCA) method, the multiple linear regression method (MLR) and the artificial neural network (ANN). The predicted values of activities are in good agreement with the experimental results. The artificial neural network (ANN) techniques, considering the relevant descriptors obtained from the MLR, showed a correlation coefficient of 0,9 with an 8-20-1 ANN model which is a good result. As a result of quantitative structure-activity relationships, we found that the model proposed in this study is constituted of major descriptors used to describe these molecules. The obtained results suggested that proposed combination of several calculated parameters could be useful in predicting biological activity of N-phenylsuccinimides derivatives. Keywords: Biological activity; 3D-QSAR model; MLR; ANN; PCA; DFT study _____________________________________________________________________________________________ INTRODUCTION Various N-phenylsuccinimide derivatives are described in the prior art with broad antimicrobial properties in U.S. Pat. No 3741981 (Chemistry Sure Chem. Open Beta). Described components are antimicrobial N- phenylsuccinimides possess a multisubstituted aromatic nucleus and an imid group which are also responsible for a good antifungal, antidepressant and anticulose activity [1]. 61 N-phenylsuccinimides with different substituting benzene ring were determined against (Botrytis Chinera BC) as antifungal [2]. The great variety of animals and fungi of man and the abundance of chemical structures of these fungi potentially active, make it difficult to assess the exact relationship between a molecular family and a biological activity type. In fact, contrary to some major pharmacological domains for which innovation develops around the defined structural archetype, the creation of new molecules with antifungal activity most often uses very different chemical structures. A study was made of the N-phenylimides active in the meta-position. Before they approached this study, they tested this substitution of compounds having the same skeleton and which interact in the same way as their analogous imides, they are N-phenylsuccinimide -3 multisubstituted on the phenyl group, and they have quantitatively analyzed the relationship between chemical structure and biological activity against B. Chinera. In this case, after the application of the method of Hansch and Fujita, only the steric effect and lipophilicity are significantly found for modeling activity pI50.[1], Principal component analysis of the studies shows the existence of the Alkoxy 198
Tahar Lakhlifi et al ______________________________________________________________________________ J. Chem. Pharm. Res., 2013, 5(9):198-209 compounds which gather in a well discerned from unlike the other remaining compounds. The studied compounds are distributed according to the shape and size of their radical. The term structure-activity relationship (SAR) describes the relationship between chemical structure and biological activity for a series of compounds [3-7]. In Anglo-Saxon terminology, we use the term structure-activity relationship or SAR. The term "SAR" actually covers different approaches, ranging from simple considerations of similarity or diversity of molecules to establish mathematical relationships linking chemical structure to a measurable activity. The SAR qualitative (qualitative SAR or QSAR) are derived from non-continuous data, such as the presence or absence of a property or activity of interest. If there are mathematical relationships quantitatively linking the chemical structure to biological activity for a series of compounds, we will speak of quantitative structure-activity relationships [3]. Finally, as it is the case in our work, the term SAR-dimensional (three-dimensional QSAR and 3D- QSA) refers to methods linking spatially modeled three-dimensional structure of compounds to other compounds [8]. The three-dimensional properties have gradually been considered since the late 1970’s with the use of statistical techniques and the improved information technology tools. Among many other techniques DYLOMMS (Dynamic Lattice-Oriented Molecular Modeling System, 1981) and CoMFA (Comparative Molecular Field Analysis, developed between 1983 and 1987) were two pioneering approaches in 3D-QSAR. The latter uses statistical correlation techniques to analyze the quantitative relationship between the activity of a series of compounds with a specified alignment and their electronic properties and three-dimensional sterics. In this work, we have relied on the same data-base studied by Takayama et al. (1983) for N-phenylsuccinimides (fig. 1) using several statistical tools: Principal Components Analysis (PCA), Multiple Linear Regression (MLR) and Artificial Neural Network (ANN) calculations. The objectives of this work are to develop predictive QSAR models for the toxicity of our studied molecules. On the other hand, several quantum chemical methods and Quantum- chemistry calculations have been performed in order to study the molecular structure and electronic properties [9,10].The geometry as well as the nature of their molecular orbital, HOMO (highest occupied molecular orbital) and LUMO (lowest unoccupied molecular orbital) is involved in the properties of biological activity of organic compounds. The more relevant molecular properties were calculated. These properties are the highest occupied molecular orbital energy EHOMO, the lowest unoccupied molecular orbital energy ELUMO, energy gap ∆E, dipole moment µ, the total energy ET, the activation energy Ea, the absorption maximum λmax and the factor of oscillation f(SO). EXPERIMENTAL SECTION Previous research [11] has developed a quantitative model of structure-activity relationships for a series of antifungal compound N-phenylsuccinimides. Further work on the electronic and steric aspects of 57 molecules was produced by Boulaamail [12]. The following table shows the chemical structures of the studied compounds and the corresponding experimental activities pI50. Fig.1: Chemical structure of studied phenylsuccinimides The experimental toxicity of the studied compounds was collected from previous work [11] (Table 1). The range of toxicity data varies from 2,00 to 5,77. Principal Components Analysis (ACP) The structures of the molecules based on N-phenylsuccinimides, (1–57) were studied by statistical methods based on the principal component analysis (PCA) [13-16] using the software XLSTAT 2009 and Mathlab software v 2009a. PCA is a statistical technique useful for summarizing all the information encoded in the structures of the compounds. It is also very helpful for understanding the distribution of the compounds. This is an essentially descriptive statistical method which aims to present, in graphic form, the maximum of information contained in the data table 1. 199
Tahar Lakhlifi et al ______________________________________________________________________________ J. Chem. Pharm. Res., 2013, 5(9):198-209 Table 1: Observed toxicity of studied N-phenylsuccinimide derivatives [11,12]. N° R pI50(obs.) N° 1 H 3,6 30 2 2-F 3,67 31 3 2-Cl 3,45 32 4 2-Br 3,23 33 5 2-Me 2,7 34 6 2-Et 2,33 35 7 2-CF3 2,16 36 8 2-OMe 2,63 37 9 2-OEt 2 38 10 2-NO2 2,8 39 11 3-F 4,2 40 12 3-Cl 4,35 41 13 3-Br 4,21 42 14 3-Me 3,44 43 15 3-Et 3,05 44 16 3-n-Pr 3,5 45 17 3-n-Bu 3,55 46 18 3-CF3 3,56 47 19 3-OMe 2,49 48 20 3-OEt 3,18 49 3-Cl, 5-COOMe 21 3-COEt 3,02 50 22 3-CO-n-Pr 3,09 51 23 3-COOMe 3,24 52 24 3-NO2 3,71 53 25 3-CN 3,77 54 26 4-F 3,68 55 27 4-Cl 3,61 56 28 4-Br 3,58 57 29 4-Me 3,03 R pI50(obs.) 3,12 3,71 2,76 2,89 3,84 3,97 3,51 3,75 4,18 5,58 5,77 3,68 4,77 2,59 4,64 4,78 5,12 4,09 3,54 5,14 5,19 3,81 4,89 3,94 5,07 4,13 5,37 4,97 4-Et 4-CF3 4-OMe 4-OEt 4-NO2 2,3-Cl2 2,4-Cl2 2,5-Cl2 3,4-Cl2 3,5-Cl2 3,5-Br2 3,4-Me2 3,4-(CF3)2 3,5-(OMe)2 3,5-(NO2)2 3-Cl,5-Me 3-Cl,5-CF3 3-OMe, 5-Cl 3-Cl, 5-COMe 3-Cl, 5-NO2 3-OMe, 5-NO2 2,3,5-Cl3 2,4,5-Cl3 3,4,5-Cl3 2-Me,3,5-Cl2 3,5-Cl2,4-Me 3,5-Cl2,4-F Multiple Linear Regressions (RLM) The multiple linear regression statistic technique is used to study the relation between one dependent variable and several independent variables. It is a mathematic technique that minimizes differences between actual and predicted values. The multiple linear regression model (MLR) [15] was generated using the software SYSTAT, version 12, to predict antifungal activities pI50. It has served also to select the descriptors used as the input parameters for a back propagation network (ANN). Artificial Neural Network (ANN) The ANN analysis was performed with the use of Mathlab software v 2009a Neural Fitting tool (nftool) toolbox on a data set of phenylsuccinimide derivatives antifungal activity [15-19]. A number of individual models of ANN were designed built up and trained. Generally the network was built of three layers; one input layer, one hidden layer and one output layer were considered [20]. The input layer was consisted of eight artificial neurons of linear activation function (Fig. 2). The number of artificial neural in the hidden layer was adjusted experimentally. The hidden layer consisted of 20 artificial neural. One neuron formed the output layer of sigmoid function activation. The architecture of the applied ANN models is presented in figure 3. Fig. 2: Neuron Layout of ANN 200
Tahar Lakhlifi et al ______________________________________________________________________________ J. Chem. Pharm. Res., 2013, 5(9):198-209 Fig. 3: The ANN architecture The data subjected to ANN analysis were randomly divided into three sets: a learning set, a validation set and a testing set. Prior to that, the whole data set was scaled within the 0-1 range. The set of N-phenylsuccinimides derivatives of antifungal activity [10] were subjected to the ANN analysis. First, for the learning set of compounds, i.e., 51 N-phenylsuccinimide derivatives were used. ANN models were designed, built and trained. The learning set of data is used in ANN to recognize the relationship between the input and output data. Then for the revision of the ANN model designed and selected, the validation set of three compounds was used. Testing set with three compounds was provided to be an independent evaluation of the ANN model performance for the finally applied network. In this study, we selected the sigmoid as a basis function [21]. The operation of the output layer is linear, which is given as below: ∑ = 1 j where yk is the kth output layer unit for the input vector X, wkj is the weight connection between the kth output unit and the jth hidden layer unit and bk is the bias that allows a transfer function “non-zero” given by the following equation: ∑ y) y ( Bias − y is the value predicted by the model The accuracy of the model was mainly evaluated by the root mean square error (RMSE). Formula is given as follows: ∑ = 1 i n where n is number of compounds, pexp is experimental value, ppred is predicted value and summation is of overall patterns in the analyzed data set [22,23]. The scripts were run on a personal PC. DFT calculations DFT (density functional theory) methods were used in this study. These methods have become very popular in recent years because they can reach similar precision to other methods in less time and less cost from the computational point of view. In agreement with the DFT results, energy of the fundamental state of a polyelectronic system can be expressed through the total electronic density, and in fact, the use of electronic density instead of wave function for calculating the energy constitutes the fundamental base of DFT [24-26], using the B3LYP functional [27,28] and a 6-31G (d) basis set. The B3LYP, a version of DFT method, uses Becke’s three-parameter functional (B3) and includes a mixture of HF with DFT exchange terms associated with the gradient corrected correlation functional of Lee, Yang and Parr (LYP). The geometry of all species under investigation was determined by optimizing all geometrical variables without any symmetry constraints. RESULTS AND DISCUSSION Our study focused on a series of 57 derivatives by QSAR N-phenylsuccinimides to determine a quantitative relationship between structure and toxicity. In this section we will use the same approach we already have applied in previous works [15,16]. Table 2 shows the values of the calculated parameters obtained from optimized structures by DFT/B3LYP 6-31G (d) optimized. n k = + y (X) w h (X) b (1) k kj j k − = − (2) where y is the measured value and n 1 = − 2 RMSE . (p p ) (3) exp pred 201
Tahar Lakhlifi et al ______________________________________________________________________________ J. Chem. Pharm. Res., 2013, 5(9):198-209 Table 2: Values of the obtained parameters by DFT/B3LYP 6-31G (d) optimization of the Studied compounds Molecules pI50 ET (Ua) EHOMO(eV) ELUMO(eV) 1 3,60 -591,7157 -6,5603 -0,5999 2 3,67 -690,9459 -6,7274 -0,6462 3 3,45 -1051,3064 -6,8900 -0,7077 4 3,23 -3162,8171 -6,7838 -0,7102 5 2,70 -631,0320 -6,7010 -0,4861 6 2,33 -670,3436 -6,6615 -0,4773 7 2,16 -928,7482 -7,0272 -1,0543 8 2,63 -706,2355 -6,1526 -0,3333 9 2,00 -745,5537 -6,0246 -0,3526 10 2,80 -796,2077 -7,2429 -2,4910 11 4,20 -690,9483 -6,6389 -0,7344 12 4,35 -1051,3107 -6,7062 -0,8272 13 4,21 -3162,8194 -6,6065 -0,8267 14 3,44 -631,0338 -6,4317 -0,5571 15 3,05 -670,3475 -6,4426 -0,5612 16 3,50 -709,6609 -6,4451 -0,5626 17 3,55 -748,9733 -6,4413 -0,5746 18 3,56 -928,7524 -6,9513 -0,9827 19 2,49 -706,2377 -5,9862 -0,5228 20 3,18 -745,5570 -5,9484 -0,5122 21 3,02 -783,6771 -6,7334 -1,5205 22 3,09 -822,9907 -6,7187 -1,5164 23 3,24 -819,5946 -6,7838 -1,2915 24 3,71 -796,2157 -7,2255 -2,4488 25 3,77 -683,9576 -7,1157 -1,5031 26 3,68 -690,9486 -6,5069 -0,7063 27 3,61 -1051,3112 -6,5736 -0,8115 28 3,58 -3162,8199 -6,4886 -0,8253 29 3,03 -631,0339 -6,3242 -0,5528 30 3,12 -670,3474 -6,3315 -0,5536 31 3,71 -928,7528 -6,9921 -1,1194 32 2,76 -706,2385 -5,8773 -0,5174 33 2,89 -745,5579 -5,8441 -0,5008 34 3,84 -796,2165 -7,2957 -2,4989 35 3,97 -1510,8958 -7,0234 -0,9901 36 3,51 -1510,9001 -7,0188 -1,0282 37 3,75 -1510,8998 -6,9042 -1,0519 38 4,18 -1510,9010 -6,7225 -1,0641 39 5,58 -1510,9040 -6,9510 -1,1276 40 5,77 -5733,4867 -6,9161 -1,3923 41 3,68 -670,3519 -6,3833 -0,5204 42 4,77 -1265,7876 -7,3205 -1,3634 43 2,59 -820,7592 -5,6543 -0,4438 44 4,64 -1000,7102 -7,7919 -3,0748 45 4,78 -1077,6114 -4,4445 1,4345 46 5,12 -1388,3459 -7,0757 -1,2831 47 4,09 -1165,8327 -6,2427 -0,7156 48 3,54 -1203,7192 -7,0953 -2,0510 49 5,14 -1279,1886 -6,8884 -1,5755 50 5,19 -1255,8079 -7,3257 -2,6849 51 3,81 -910,7385 -6,6640 -2,4039 52 4,89 -1970,4881 -7,0586 -1,3057 53 3,94 -1970,4889 -7,0392 -1,2893 54 5,07 -1970,4894 -6,9055 -1,2940 55 4,13 -1550,2198 -6,8271 -0,9879 56 5,37 -1550,2209 -6,7835 -0,9863 57 4,97 -1610,1294 -6,9058 -1,0680 ∆Ε ∆Ε ∆Ε ∆Ε (eV) 5,9604 6,0813 6,1823 6,0737 6,2150 6,1842 5,9729 5,8193 5,6720 4,7519 5,9046 5,8790 5,7798 5,8746 5,8814 5,8825 5,8667 5,9685 5,4634 5,4362 5,2129 5,2023 5,4923 4,7767 5,6126 5,8005 5,7621 5,6633 5,7714 5,7779 5,8727 5,3600 5,3433 4,7968 6,0334 5,9906 5,8523 5,6584 5,8234 5,5239 5,8629 5,9571 5,2105 4,7171 5,8790 5,7926 5,5271 5,0444 5,3128 4,6408 4,2601 5,7529 5,7499 5,6116 5,8392 5,7973 5,8378 µ µ µ µ (D) 1,4523 1,1461 1,3898 1,2111 1,2511 1,3112 1,7861 1,4790 1,6693 3,5872 2,6065 3,1054 2,9881 1,2406 1,2961 1,3013 1,3905 3,7494 0,1011 0,1627 4,4899 4,4091 1,4675 5,7305 5,7170 2,8758 3,5441 3,4238 1,0102 1,0352 4,3977 1,3790 1,2063 6,7469 2,8420 2,6818 1,5840 4,4349 3,7466 3,9608 1,0196 4,5359 1,3193 6,7519 3,8476 4,1774 1,9913 6,6653 1,6278 5,7606 4,7508 2,6518 2,9869 4,8463 3,6619 2,9673 4,7577 λ λ λ λmax (nm) 251,4000 271,3100 250,7500 250,9800 252,7900 253,0100 249,8000 252,9000 256,5600 331,2700 251,2500 244,1200 261,8300 251,5700 297,5100 262,3700 287,6000 261,5500 266,4600 261,0400 269,4100 337,1900 273,9000 328,0600 254,3100 251,2300 251,2700 251,3700 251,6400 251,6300 251,3100 262,1500 263,0200 330,4200 250,5500 250,9800 250,7400 263,0900 264,6000 267,0700 263,9500 262,0600 296,8500 325,4600 267,7500 266,5200 282,6100 344,9000 266,8700 319,3900 315,0100 261,8800 262,1400 267,1800 264,3400 264,4400 263,5300 Ea (eV) 4,9317 4,5698 4,9445 4,9401 4,9047 4,9004 4,9633 4,9025 4,8326 3,7427 4,9347 5,0789 4,7353 4,9285 4,1674 4,7255 4,3110 4,7403 4,6530 4,7497 4,6021 3,6770 4,5266 3,7793 4,8753 4,9351 4,9344 4,9323 4,9271 4,9273 4,9336 4,7296 4,7138 3,7523 4,9486 4,9401 4,9447 4,7125 4,6857 4,6423 4,6973 4,7311 4,1767 3,8095 4,6306 4,6519 4,3871 3,5948 4,6459 3,8818 3,9359 4,7345 4,7296 4,6404 4,6904 4,6885 4,7047 f(SO) 0,0014 0,0011 0,0013 0,0012 0,0012 0,0012 0,0019 0,0017 0,0042 0,0084 0,0024 0,0110 0,0012 0,0018 0,0014 0,0012 0,0005 0,0013 0,0024 0,0022 0,0201 0,0002 0,0013 0,0002 0,0099 0,0012 0,0012 0,0013 0,0015 0,0015 0,0016 0,0181 0,0180 0,0004 0,0008 0,0020 0,0020 0,0058 0,0072 0,0106 0,0018 0,0010 0,0003 0,0001 0,0020 0,0020 0,0003 0,0001 0,0017 0,0005 0,0003 0,0090 0,0075 0,0032 0,0041 0,0037 0,0008 Principal component analysis (Training Set Selection) The selection of the training set is one of the most important steps in the QSAR modeling, since the establishment and optimization of a QSAR model are based on this training set. Predictability and applicability of a QSAR model also depend on the training set selection. In this part, PCA was applied to select a training set from among 57 compounds. The set of descriptors encoding the 57 antifungal compounds and electronic and energetic parameters are submitted to PCA analysis [13]. The first three principal axes are sufficient to describe the information provided by the data matrix. Indeed, the percentages of variance are 45,95%; 20,73% and 18,77% for the axes F1, F2 and F3 respectively. The total information is estimated to a percentage of 85,45%. 202
Tahar Lakhlifi et al ______________________________________________________________________________ J. Chem. Pharm. Res., 2013, 5(9):198-209 The principal component analysis (PCA) [15,16,28] was conducted to identify the link between the different variables. Bold values are different from 0 at a significance level of p=0,05. Correlations between the eight descriptors are shown in table 3 as a correlation matrix and in figure 4 these descriptors are represented in a correlation circle. The Pearson correlation coefficients are summarized in the following table 3. The obtained matrix provides information on the negative or positive correlation between variables. Table 3: Correlation matrix (Pearson (n)) between different obtained descriptors Variables pI50 ET EHOMO ELUMO pI50 1 ET -0,486 1 EHOMO -0,331 0,187 1 ELUMO -0,269 0,090 0,815 1 ∆ ∆ ∆ ∆E -0,059 -0,072 0,181 0,717 µ µ µ µ 0,494 -0,180 -0,537 -0,686 -0,519 Ea -0,065 -0,116 0,242 0,646 λ λ λ λmax 0,045 0,124 -0,264 -0,662 -0,806 0,546 -0,997 f (SO) -0,016 -0,107 0,105 0,013 -0,103 0,005 Bold values are different from 0 at a level significant for p<0,05 At a very significant for p<0,01 At a highly significant to p<0,001 * The HOMO energy EHOMO is positively correlated with the LUMO energy ELUMO (r=0,815 and p <0,05) at a significant level. * The LUMO energy ELUMO is positively correlated with the gap energy ∆ ∆ ∆ ∆E (eV) (r=0,717 and p<0,05) and negatively correlated with the dipole moment µ (r=0,686 and p<0,05) a significant level. * The gap energy ∆ ∆ ∆ ∆E (eV) is positively correlated with the activation energy Ea (r=0,807 and p<0,05) and negatively correlated with maximum absorption of λmax (r=0,806 and p<0,05) at a significant level. * The activation energy Ea is strongly correlated with λmax for r=0,997 and p<0,001 at a high level. Correlation circle The principal component analysis (PCA) was also performed to detect the connection between the different variables. The principal component analysis revealed the correlation circle (Fig. 4) shows that the F1 axis appears to represent the variables (ELUMO, Ea, λmax) with some neighboring (83%, 75%, 77%) respectively, and the F2 axis seems to represent the variable (pI50, ET) with a few neighbors to 57%. ∆ ∆ ∆ ∆E 1 µ µ µ µ 1 λ λ λ λmax 1 Ea 1 f (SO) 1 0,807 -0,530 0,159 -0,171 Fig. 4: Correlation circle The Cartesian diagram (Fig. 5) allowed us to highlight the most toxic molecules along the toxicity axis and molecules with heavy ∆ ∆ ∆ ∆E along the gap energy axis. 203
Tahar Lakhlifi et al ______________________________________________________________________________ J. Chem. Pharm. Res., 2013, 5(9):198-209 Fig. 5: Cartesian diagram according to F1 and F2: Correlation between electronic parameters and individuals (molecules) Analysis of projections according to the plan F1-F2 (66,68% of the total variance) of the studied molecules (Fig. 6) shows that the molecules are dispersed, according to the structure of the R group of phenylsuccinimides, in two classes of compounds belonging to two regions: the first region contains a N-phenylsuccinimides attractor by mesomeric effect and the second one contains donor by mesmeric effect. Fig. 6: Cartesian diagram according to F1 and F2: attractor by mesomeric effect and donor by mesomeric effect both grouped in two separate regions Figure 6 shows a distribution of molecules in two regions: the region 1 containing attractor motifs with (λmax >300nm, Ea<4 eV, ∆E<5, 20 eV) and the region 2 containing donor motifs with (λmax < 300nm, Ea > 4eV, ∆E > 5,20eV). In this representation, the compounds 18 and 31 that should be in region 1 (attractor by mesomeric effect) are an exception because they contain R groups which are not similar to those of other compounds of this series. Multiple linear regressions To establish quantitative relationships between toxicity pI50 and selected descriptors, our array data were subjected to a multiple linear and nonlinear regression. Only variables whose coefficients are significant were retained. 204
Tahar Lakhlifi et al ______________________________________________________________________________ J. Chem. Pharm. Res., 2013, 5(9):198-209 *Multiple linear regressions (MLR) Many attempts have been made to develop a relationship with the indicator variable of toxicity pI50, but the best relationship obtained by this method is only one corresponding to the linear combination of several descriptors: the total energy ET, energy EHOMO, energy ELUMO, activation energy Ea, the dipole moment µ, absorption maximum λmax and factor of oscillation f(SO). pI50 = 99,234 – 3,01.10-4 ET – 0.296 EHOMO + 9,514.10-2 ELUMO + 0,318 µ µ µ µ – 11,098 Ea– 0,175 λmax – 26,193 f(SO) (4) Fig. 7: Graphical representation of calculated and observed toxicity by MLR For our 57 compounds, the correlation between experimental toxicity and calculated one based on this model is quite significant (Fig. 7) as indicated by statistical values: N = 57 R = 0,759 R2 = 0,575 RMSE = 0,617 The figure 7 shows a very regular distribution of toxicity values depending on the experimental values. *Multiple nonlinear regressions (MNLR) We have also used the technique of nonlinear regression model to improve the structure-toxicity in a quantitative way, taking into account several parameters. This is the most common tool for the study of multidimensional data. The resulting equation is: pI50 = 17069,097 – 3,776.10-4 ET – 6,981 EHOMO + 4,568 ELUMO + 0,446 µ µ µ µ –2608,975 Ea – 39,828 λ λ λ λmax + 54,8 f(SO) – 2,992.10-8 ET λ λ λ λ2 The obtained parameters describing the electronic aspect of the studied molecules are: N = 57 R = 0,812 R2 = 0,660 RMSE = 0,611 The toxicity value pI50 predicted by this model is somewhat similar to that observed. Figure 8 shows a very regular distribution of toxicity values based on the observed values. The obtained coefficient of correlation in equation (5) is quite interesting (0,660). To optimize the error standard deviation and better finish building our model, we involve in the next part artificial neural networks (ANN). As part of this conclusion, we can say that the toxicity values obtained from nonlinear regression are highly correlated to that of the observed toxicity comparing to results obtained by MLR method. 2 – 0,206 E2 (SO) HOMO + 0,417 E2 LUMO – 0,366 ∆ ∆ ∆ ∆E2–3,904.10-2µ µ µ µ2 + 148,35 E2 a +3,454.10-2 (5) max – 4965,923 f 2 205
Tahar Lakhlifi et al ______________________________________________________________________________ J. Chem. Pharm. Res., 2013, 5(9):198-209 Fig. 8: Graphical representation of calculated and observed toxicity by MNLR Artificial neural network (ANN) In order to increase the probability of good characterization of studied compounds, neural network (ANN) can be used to generate predictive models of quantitative structure-activity relationships (QSAR) between a set of molecular descriptors obtained from the MLR and observed activity. The ANN calculated toxicity model were developed using the properties of several studied compounds. The correlation between ANN calculated and experimental toxicity values is very significant as illustrated in figure 9 and as indicated by R and R2 values. N = 57 R = 0,983 R2 = 0,967 RMSE = 0,161 These values show that the relationship between the estimated values of pI50 and their residues established by artificial neural networks are illustrated in figure 10. Fig. 9: Correlation between the calculated and experimental inhibition pI50 The statistic of the tree steps of the calculation by the ANN: Training, validation and test are illustrated in table 4. Table 4: Values obtained by ANN R2 Samples RMSE 51 3 3 R Training Validation Test 0.0212 0.987 0,972 0.234 0.978 0,954 0.450 0.720 0,512 R: correlation coefficient; R2: determination coefficient; RMSE: root mean square error. 206
Tahar Lakhlifi et al ______________________________________________________________________________ J. Chem. Pharm. Res., 2013, 5(9):198-209 Fig. 10: Relationship between the estimated values of pI50 and their residues established by artificial neural networks The obtained squared correlation coefficient (R2) value is 0,967 for this data set of phenylsuccinimides. It confirms that the artificial neural network results were the best to build the quantitative structure activity relationship models. In this part, we investigated the best linear QSAR regression equations established in this study. Based on this result, a comparison of the quality of CPA, MLR and ANN models shows that the ANN models have substantially better predictive capability because the ANN approach gives better results than MLR. ANN was able to establish a satisfactory relationship between the molecular descriptors and the activity of the studied compounds. CONCLUSION In this work we have investigated the QSAR regression to predict toxicity of several compounds based on phenylsuccinimides. Comparison of key statistical terms like R or R2 of different models obtained by using different statistical tools and different descriptors has been shown in table 5. The studies of the quality of the MLR and ANN models have shown that the ANN result have substantially better predictive capability than the other methods. With ANN approach we have established a relationship between several descriptors (EHOMO, ELUMO, …) and toxicity in satisfactory manners. Finally, we can conclude that studied descriptors (EHOMO, ELUMO, …), which are sufficiently rich in chemical and electronic information to encode the structural features, may be used with other topological descriptors for the development of predictive QSAR models. 207
Tahar Lakhlifi et al ______________________________________________________________________________ J. Chem. Pharm. Res., 2013, 5(9):198-209 Table 5: Observed values and calculated of pI50 according to different methods N° R pI50(obs.) 1 H 3,6 2 2-F 3,67 3 2-Cl 3,45 4 2-Br 3,23 5 2-Me 2,7 6 2-Et 2,33 7 2-CF3 2,16 8 2-OMe 2,63 9 2-OEt 2 10 2-NO2 2,8 11 3-F 4,2 12 3-Cl 4,35 13 3-Br 4,21 14 3-Me 3,44 15 3-Et 3,05 16 3-n-Pr 3,5 17 3-n-Bu 3,55 18 3-CF3 3,56 19 3-OMe 2,49 20 3-OEt 3,18 21 3-COEt 3,02 22 3-CO-n-Pr 3,09 23 3-COOMe 3,24 24 3-NO2 3,71 25 3-CN 3,77 26 4-F 3,68 27 4-Cl 3,61 28 4-Br 3,58 29 4-Me 3,03 30 4-Et 3,12 31 4-CF3 3,71 32 4-OMe 2,76 33 4-OEt 2,89 34 4-NO2 3,84 35 2,3-Cl2 3,97 36 2,4-Cl2 3,51 37 2,5-Cl2 3,75 38 3,4-Cl2 4,18 39 3,5-Cl2 5,58 40 3,5-Br2 5,77 41 3,4-Me2 3,68 42 3,4-(CF3)2 4,77 43 3,5-(OMe)2 2,59 44 3,5-(NO2)2 4,64 45 3-Cl,5-Me 4,78 46 3-Cl,5-CF3 5,12 47 3-OMe, 5-Cl 4,09 48 3-Cl, 5-COMe 3,54 49 3-Cl, 5-COOMe 5,14 50 3-Cl, 5-NO2 5,19 51 3-OMe, 5-NO2 3,81 52 2,3,5-Cl3 4,89 53 2,4,5-Cl3 3,94 54 3,4,5-Cl3 5,07 55 2-Me,3,5-Cl2 4,13 56 3,5-Cl2,4-Me 5,37 57 3,5-Cl2,4-F 4,97 pI50(calc.) MLR NMLR ANN 3,046 3,105 3,567 3,585 3,226 3,169 3,784 3,524 3,108 2,862 3,137 2,95 3,264 3,443 3,048 3,08 3,151 3,238 2,858 3,565 3,42 3,479 3,119 3,609 4,662 4,51 2,952 2,906 3,41 3,214 3,379 3,405 3,625 3,607 4,31 4,192 2,922 2,953 2,823 2,677 4,054 3,692 2,975 2,623 3,685 4,086 3,909 3,687 4,404 4,308 3,5 3,482 3,832 3,667 4,406 4,336 2,858 2,837 2,88 2,855 4,152 3,898 2,789 2,385 2,764 2,552 4,13 3,699 3,841 3,641 3,773 3,71 3,379 3,588 4,549 4,729 4,389 4,59 5,653 5,515 3,284 3,255 4,755 4,541 3,282 2,884 4,526 4,762 3,99 4,69 4,687 4,769 3,902 4,013 3,435 3,635 3,772 4,248 4,434 4,625 4,011 3,753 4,08 4,307 4,231 4,67 5,004 5,081 4,425 4,408 4,205 4,431 4,876 4,602 3,59 3,659 3,45 3,24 2,727 2,384 2,217 2,665 2,063 2,828 4,168 4,31 4,176 3,47 3,067 3,496 3,545 3,554 2,532 3,19 2,941 3,106 3,248 3,698 3,755 3,667 3,603 3,574 3,061 3,12 3,697 2,79 2,915 3,331 3,946 3,563 3,736 4,412 5,484 5,668 3,667 4,711 2,627 4,586 4,725 5,045 4,061 3,536 5,063 5,112 3,791 4,825 3,917 4,997 5,138 5,283 4,902 Acknowledgements We are grateful to the “Association Marocaine des Chimistes Théoriciens” (AMCT) for its pertinent help concerning the programs. REFERENCES [1] C Takayama; A Fujinami, Pest. Biochem. Physiol., 1979, 12, p 163. [2] A Fujinami; M Eto, Ed Soft Science, Tokyo, 1985, p 445. [3] CG Wermuth; CR Ganellin; P Lindberg; LA Mitscher, (IUPAC Recommendations), Pure Appl Chem., 1998, 70, 1129-43. 208
Tahar Lakhlifi et al ______________________________________________________________________________ J. Chem. Pharm. Res., 2013, 5(9):198-209 [4] S Qanei Nassab; Z Bayat; J Movaffagh, Journalof Chemical and Pharmaceutical Research, 2011, 3(1): 64-71. [5] B Bhuwan Mishra; A Giri; K Rajesh Singh and P Pashupati Singh, Journalof Chemical and Pharmaceutical Research, 2011, 3(6): 423-432. [6] K Mahesh; N Sumitra; N Aggrwal; BP Nagori; VP Dubey; A Sharma, Journalof Chemical and Pharmaceutical Research, 2010, 2(4): 159-165. [7] PP Singh; SB Sharma; K Singh, Journalof Chemical and Pharmaceutical Research, 2010, 2(5): 193-205. [8] GR Marshall; RD Cramer III, Trends Pharmacol. Sci.,1988, 285-9. [9] K Laarej; M Bouachrine; S Radi; S Kertit and B Hammouti, E-Journal of Chemistry, 2010, 7(2), 419-424. [10] H Zarrok; H Oudda; A Zarrouk; R Salghi; B Hammouti; M Bouachrine, Der Pharma Chemica, 2011, 3 (6): 576-590. [11] C Takayama; AO Fujinami; J Kato, Pestic. Sci., 1983, 8, p 193. [12] A Boulaamail, Thesis, 1996. [13] STATITCF Software, Technical Institute of cereals and fodder, 1987, Paris, France. [14] JN Hogarh; N Seike; Y Kobara; A Habib; JJ Namd; JS Lee; X Qilu Li Liu; L Jun; G Zhang; S Masunaga, Chemosphere, 2012, 86: 718-726. [15] M Larif; A Adad; R Hmammouchi; AI Taghki; A Soulaymani; A Elmidaoui; M Bouachrine; T Lakhlifi, in press in Arabian Journal of Chemistry, 2013, http://dx.doi.org/10.1016/j.arabjc.2012.12.033. [16] A Adad; R Hmammouchi; AI Taghki; A Abdellaoui; M Bouachrine and T Lakhlifi, Journalof Chemical and Pharmaceutical Research, 2013, 5(7): 28-41. [17] H Demuth; M Hugan; M Beal, Neural Network Toolbox. For use with MATHLAB, User Guid’s, 2011, Version 9. [18] D Zakarya ; EM Larfaoui; A Boulaamail and T Lakhlifi, SAR and QSAR in Environmental Research, 1996, 5, 269-279. [19] D Zakarya; A Boulaamail; EM Larfaoui and T Lakhlifi, SAR and QSAR in Environmental Research, 1997, 6, 183-203. [20] J Zupan; J Gasteiger, Neural Networks for Chemistry and Drug Design: An Introduction, second ed., VCH, Weinheim, 1999. [21] N Turkkan, Revue de l’Université de Moncton, 1993, 26 (1), 205-221. [22] PY Lee; CYJ Chen, Hazard. Mater., 2009, 165, 156-161. [23] G Jing; Z Zhou; J Zhuo, Chemosphere, 2012, 86, 76-82. [24] C Adamo, V Barone, Chem. Phys. Lett., 2000, 330, 152-160. [25] M Parac; S Grimme; All calculations were done by GAUSSIAN 03 W software, J. Phys. Chem., 2003, A 106, 6844-6850. [26] Gaussian 03, Revision B.01, M J Frisch; and al., Gaussian Inc., 2003, Pittsburgh, PA. [27] AD Becke, J. Chem. Phys., 1993, 98, 1372. [28] C Lee; W Yang; RG Parr, Phys. Rev., 1988, B. 37, 785-789. 209