Download
1 / 8
80 likes | 91 Views
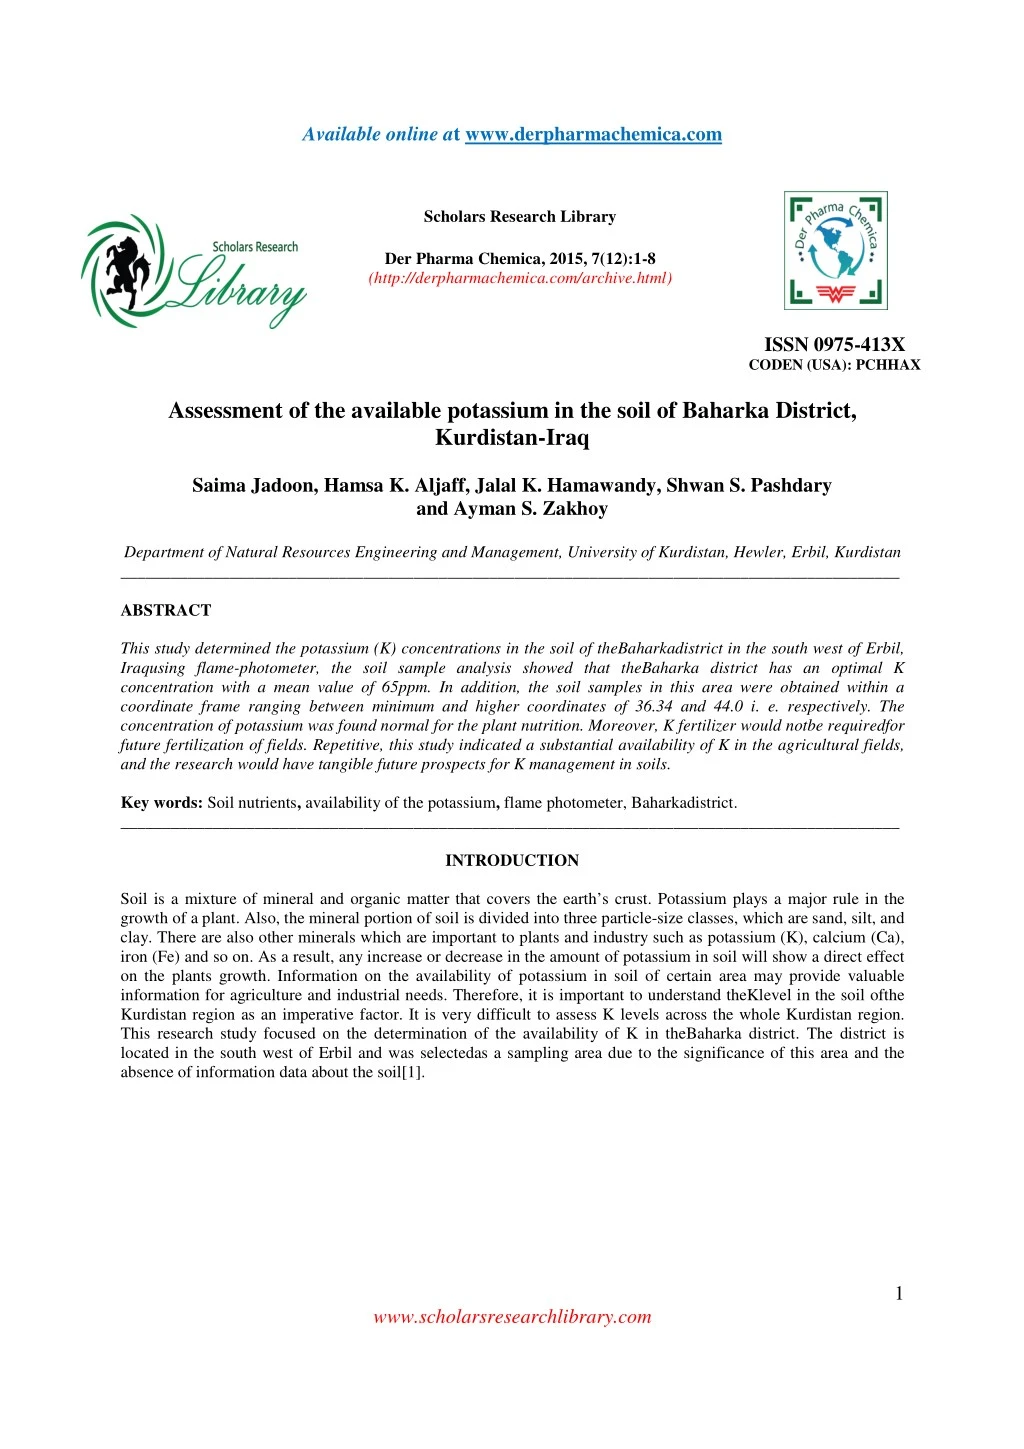
This study determined the potassium (K) concentrations in the soil of theBaharkadistrict in the south west of Erbil,<br>Iraqusing flame-photometer, the soil sample analysis showed that theBaharka district has an optimal K<br>concentration with a mean value of 65ppm. In addition, the soil samples in this area were obtained within a<br>coordinate frame ranging between minimum and higher coordinates of 36.34 and 44.0 i. e. respectively. The<br>concentration of potassium was found normal for the plant nutrition. Moreover, K fertilizer would notbe requiredfor<br>future fertilization of fields. Repetitive, this study indicated a substantial availability of K in the agricultural fields,<br>and the research would have tangible future prospects for K management in soils.

E N D
Available online a www.derpharmachemica.com t Scholars Research Library Der Pharma Chemica, 2015, 7(12):1-8 (http://derpharmachemica.com/archive.html) ISSN 0975-413X CODEN (USA): PCHHAX Assessment of the available potassium in the soil of Baharka District, Kurdistan-Iraq Saima Jadoon, Hamsa K. Aljaff, Jalal K. Hamawandy, Shwan S. Pashdary and Ayman S. Zakhoy Department of Natural Resources Engineering and Management, University of Kurdistan, Hewler, Erbil, Kurdistan _____________________________________________________________________________________________ ABSTRACT This study determined the potassium (K) concentrations in the soil of theBaharkadistrict in the south west of Erbil, Iraqusing flame-photometer, the soil sample analysis showed that theBaharka district has an optimal K concentration with a mean value of 65ppm. In addition, the soil samples in this area were obtained within a coordinate frame ranging between minimum and higher coordinates of 36.34 and 44.0 i. e. respectively. The concentration of potassium was found normal for the plant nutrition. Moreover, K fertilizer would notbe requiredfor future fertilization of fields. Repetitive, this study indicated a substantial availability of K in the agricultural fields, and the research would have tangible future prospects for K management in soils. Key words: Soil nutrients, availability of the potassium, flame photometer, Baharkadistrict. _____________________________________________________________________________________________ INTRODUCTION Soil is a mixture of mineral and organic matter that covers the earth’s crust. Potassium plays a major rule in the growth of a plant. Also, the mineral portion of soil is divided into three particle-size classes, which are sand, silt, and clay. There are also other minerals which are important to plants and industry such as potassium (K), calcium (Ca), iron (Fe) and so on. As a result, any increase or decrease in the amount of potassium in soil will show a direct effect on the plants growth. Information on the availability of potassium in soil of certain area may provide valuable information for agriculture and industrial needs. Therefore, it is important to understand theKlevel in the soil ofthe Kurdistan region as an imperative factor. It is very difficult to assess K levels across the whole Kurdistan region. This research study focused on the determination of the availability of K in theBaharka district. The district is located in the south west of Erbil and was selectedas a sampling area due to the significance of this area and the absence of information data about the soil[1]. 1 www.scholarsresearchlibrary.com
Saima Jadoon et al _____________________________________________________________________________ Der Pharma Chemica, 2015, 7 (12):1-8 Figure 1: Components of soil [2] Potassium is a major mineral that exists within soil and plays a major role in plant growth [3]. Potassium is essential for crop production and stimulates early plant growth,increases protein production, improves the efficiency of water use, which is vital for is the connected to, longevityan winter hardiness, and improves resistance to diseases and insects[4]. Figure 2:Potassium dynamics in soil [5] Therefore, in order to determine the percentage of potassium, several pieces of equipment are used. One of the most important pieces equipment is aflame photometer. It is used due to its simplicity, lack of error, high quality of work andthe short time needed to complete the K analysis. 1.2. Relationship of K with other elements For a plant to build up protein and have a good living cells function they need thirteen nutrients. These essential nutrients are given as follows: 1.Primary nutrients:nitrogen (N), phosphorus (P) and potassium (K) 2.Secondary nutrients: calcium (Ca), magnesium (Mg) and slur(S) 3.Micro-nutrients:boron (B), copper (Cu), iron (Fe), chloride (Cl), manganese (Mn), molybdenum (Mo) and zinc (Zn). Even though plants need fewer micronutrients, they are still important for good growth [6].The combination of those primary and secondary nutrients in an exact amount will give a suitable quality of soil. Conducive quality of soil isessential for healthy crop growth.Figure 3 shows the occurrence of potassium as affected by the occurrence of other elements. The existence of K in soil has a direct effect on the plant growth and plant nutrition. This directly affects the agricultural productivity. Potassium increases crop yield and improves its quality in a way that it can be considered as one of the main mineral constituents in soil which is required for a large number of processes that 2 www.scholarsresearchlibrary.com
Saima Jadoon et al _____________________________________________________________________________ Der Pharma Chemica, 2015, 7 (12):1-8 relate to the growth of the plants [7].It is essential to determine the exact amount of K in soil for fertilization management of the soils of theBaharka district. Figure 3: Occurrence of K as affected by other elements [6] 1.3. Flame-photometer A flame-photometer (model PFP7 Jenway, UK)was used to determine theK content in soil. The instrumentis also used to investigate the concentrations of different types of minerals and heavy metals in soil. Overall, to examine the concentration of different elements contained in different samples, the solutions of the desired samples are aspirated to the nebulizer and passed to the flame which is fuelled by propane and air, or a different gaseous mixture. Later, the solution of the sample is evaporated and eventually atomized. After that, the atom will gain an additional energy from the flame, and as a result return to ground state in which it emits a radiation of a different wave length depending on the energy level of the atoms, Later, the flame photometer directly selects the wave length of the desired element by a filter,and finally the intensity of the emission is measured in accordance with the concentration of the original sample (Monzir-pal.net/Lab) [8]. This instrument was used for the determination of different type of minerals concentration in soil due to the high accuracy of the performance, low cost, minimum rate of error, and accurate data in a short period of time. 3 www.scholarsresearchlibrary.com
Saima Jadoon et al _____________________________________________________________________________ Der Pharma Chemica, 2015, 7 (12):1-8 Figure 4: Flame photometer instrumentused to determine the K concentration Figure 5: Mechanism of the instrument to determine K in the soil sample by flame photometer [9] 1.4. Agricultural importance of Baharkain Kurdistan Baharka is a small town about 10km north of the Kurdish city of Erbil, Iraq. It is a nice residential area which rich soil. Soil is useful for agricultural activities. Map1: Location of Baharka, Erbil on the map [10] Map 2: Location of Baharka on the map [10] 4 www.scholarsresearchlibrary.com
Saima Jadoon et al _____________________________________________________________________________ Der Pharma Chemica, 2015, 7 (12):1-8 MATERIALS AND METHODS 2.1. Data collection Soil sampling was done from 30cm soil depth (root zone).The samples were collected in a random pattern in an average of 5 to 7 samples. In addition, to reach the target and obtain better and accurate soil samples, the roads, along with low, salty, wet areas were avoided [11]. Table 1: Latitude and altitude of sampling area Number of samples Latitude of place N Longitude of place E 1 36.339166666 2 36.339427 3 36.339451 4 36.319302 5 36.339103 6 36.335050 7 36.339318 Soil samples were collectedfrom an agricultural area ofBaharkato examine the concentration of K in soil using a flame photometer. Before the determination of K in soil samples, the instrument was calibrated with a standard solution of K. 2.2.3. Preparation of soil samples Soil samples were collected and then dried.The samples were placed in the oven (Goshin Model: SM-73 com)for a given period. Thereafter, the samples were sieved by a 2mm sieve to obtain a fine grain soil. Each soil sample was weighed upto 5g using the sensitive balance (ae ADAM PGW 253m). 50mL ammonium acetate (CH3COONH4) solution was pouredin to agraduated cylinder. For the preparation of the ammonium acetate (Sigma company) mature 38.5g the Ammonia crystal by using a sensitive balance, then diluted in 29 mL of Glacial acetic acid (C2H4O4).The soil samples wereshakenfor 30 munition and then left for a while.Then samples were passed through afilter paper.The filtered mixture was read on theflame photometer to determine the K content in soil [12]. Altitude of place (m) 466 459 496 480 472.0 467.0 473 44.0018 44.005050 44.005112 44.005199 44.005094 44.005316 44.005416 2.2.2. Preparation of standard solutions of K Standard solutions of K were prepared for the calibration of theflame photometer. For this purpose, 5 standard solutions were prepared i. e., 0, 20, 40, 60, 80 and 100ppm. Ammonium acetate solution was used as a blank. After calibration, the soil samples were fed to the flame to determine the K contents in soil. Data Analysis The data were analyzed for statistical parameters [13]. The statistical method used is given as follows: ???? =∑?? ???? = 165 ???? = Where Xi is the sum of the concentration of the samples; N is the number of the collected samples; ????? = ??????? ????? ?? ? ????????????? − ??????? ????? ?? ? ????????????? ?? ????? = 211 ??? − 146 ??? = 65 ??? Standard Deviation = %??? ? !" # # $ ? ??? ? !" # $ ??? ? !" = '(.'' & SD = (xi-x-) (xi-x-) 2= = * $= 5.058 =-?xi − x−!2 & = 30.33 ? The confidence interval 5 www.scholarsresearchlibrary.com
Saima Jadoon et al _____________________________________________________________________________ Der Pharma Chemica, 2015, 7 (12):1-8 Z a/2*12 √#=10.89047934 Xmean±Z a/2* = 175.9, 154.1 12 5?#! RESULTS AND DISCUSSION Table 2: Concentrations of standard solution byflame photometer No Concentration(ppm) 1 2 3 4 5 6 0 20 40 60 80 100 Figure 6: Calibration graph of the standard solution byflame photomer Calibration Curve concentration (ppm) 100 80 60 40 20 0 1 2 3 Numbers 4 5 6 Table 3: Soil samples concentration of K Samples Concentration (ppm) 0 1 2 3 4 5 6 7 Sum 0 185 146 211 197 186 194 201 1320 The range of the results was 65ppm, with 30.33 standard deviation obtained within a range of the seven samples, and confidence interval was±10.89. 6 www.scholarsresearchlibrary.com
Saima Jadoon et al _____________________________________________________________________________ Der Pharma Chemica, 2015, 7 (12):1-8 Figure 7: Graphical representation of the concentration of Kin different places of Baharka district 250 200 Samples 150 optimal Potassium Concentratio n in Bahrka district 100 50 0 Baharka district . . DISCUSSION From the analysis of soil samples, it was concluded that there were three levels of potassium concentrations in soil (high, low and optimum), according to the modified Kelowna method for the determination of K concentration. In thecase of higher concentration (> 400 ppm), the ability of the soil to work in balance with the applied fertilizer was incompatible [14], [15]. While in the case of the lower concentration < 125 ppm K, the result of such concentration in soil will lead to a decrease in the productivity of the soil [16]. In the third case where the concentration of the potassium is optimum, this is the same type of concentration that was obtained in the conducted experiment of this research paper concluded by comparing between the standard international concentrations of potassium in agriculture [15], and the results information collected from the Baharka land. It concluded that the agriculture area of Baharka district had an optimal rate of potassium with a range of 65ppm and Standard Deviation of 30.33 and confidence interval was ±10.8, so our results will range between 175.9ppm, and 154.1ppm. The results indicate that this area is considered as a good agricultural area, and the concentration is not harmful for the plants. CONCLUSION As long as the potassium percentage remain at the same rate, the growth of olive there which are concentrated in that area will not be affected. According to what has been discussed, more no more fertilize, is need especially for the olive plants. It is concluded that the farmers do not need to add more fertilizer or decrease the amount of potassium in the area. The following recommendations are suggested: 1.The land must be examined in order to keep the normal range of potassium. 2.Record the change of potassium concentration in the soil, and note the changes every year. Acknowledgement This report was the outcome of a cooperative effort between staff at theUniversity of Kurdistan-Hewler who helped and supported authors in achieving these result. REFERENCES [1] Omanga, K. Jackson, M., andHarun, H.,International Journal of Agriculture and Forestry, 2013, 3(7): 294-302 DOI: 10.5923/j.ijaf.20130307.06. Chemistry Department Kenyatta, Kenya University.P1-17. [2]Jonathan Deenik,PHDthesis, University of Hawii(Aug 10-11- 2015). 7 www.scholarsresearchlibrary.com
Saima Jadoon et al _____________________________________________________________________________ Der Pharma Chemica, 2015, 7 (12):1-8 [3]Susan Tandy, Simon Mundus, HaoZhang , Enzo Lombi, Jens Frydenvang, Peter E. Holm and Søren Husted, Environmental Chemistry , 2014, 9(1) 14-23. [4]Rehm, G, &Schmitt, Potassium for crop production, 2002, Extension soil scientist 2002 Regents of the University of Minnesota. [5] Ferguson, Richard. Krista DeGroot, Editor, Nutrient Management for Agronomic Crops in Nebraska, University of Nebraska-Lincoln Extension Service,2000, EC 01-155-S [6]R.N. Roy, A. Finck, G.J. Blair, & H.L.S. Tandon,Plant nutrition for food security, 2006, Food and agriculture organization of the united nations,Roma, 2006. [7]Donald L. Armstrong, Better Crops with Plant Food, 1998, Potash & Phosphate Institute (PPI),Periodicals postage paid at Norcross (ISSN:0006-0089), GA, and at additional mailing offices (USPS 012-713). [8]http://www.monzirpal.net/Lab%20Manuals/Practical%20Instrumental%20Analysis/Instrument%20Book/Instboo k/Flame_photometry.htm. [9]http://www.pharmatutor.org/articles/analysis-sodium-levels-junk-food-flame-photometer?page=0,2). [10]http://www.google.iq/maps/place/Baharka@36.2091269,44.0081934, 14z/data=! 4m! 3m1! s0xo:0x769f511787ca8ce9. [11]United States Department of Agriculture, Natural Resources Conservation Service Conservation Practice Standard(NRCS), IDAHO June2007, ID-590. [12]BhanubenK.Patel&SwantibwnA.Jain.et al, Scholars research library Archives of Applied science research, 2014, 6 (1):79-84. [13]Rayland Levesque, 2007, SPSS Programming and Data Management: A Guide for SPSS and SAS Users (4th ed.), Chicago, Illionis: SPSS Inc. [14] Azhar Hussain, Muhammad Arshad, Tanviar Ahmed, QudsiaNazir, Ayesha Mustafa, Ali Afzal, Hassan Zeb, International Journal of Agronomy and Agricultural Research, 2015,6,256-267. [15]Orland schmidt, Geoff Hunghes, Nutrient Management Factsheet, 2010, 7, Order Reference No. 631.500-5. [16]Madaras, M.Koubova, M.Smatanova, plant soil environment, 2014, 60, NO.8: 358-363. 8 www.scholarsresearchlibrary.com